- Home
- Introduction
- Performance Characteristics
- Measurement Errors
- Measuring Instruments
- DC Voltmeters
- AC Voltmeters
- Other AC Voltmeters
- DC Ammeters
- AC Ammeter
- OHMMeters
- MultiMeter
- Signal Generators
- Wave Analyzers
- Spectrum Analyzers
- Basics of Oscilloscopes
- Special Purpose Oscilloscopes
- Lissajous Figures
- CRO Probes
- Bridges
- DC Bridges
- AC Bridges
- Other AC Bridges
- Transducers
- Active Transducers
- Passive Transducers
- Measurement Of Displacement
- Data Acquisition Systems
Spectrum Analyzers
The electronic instrument, used for analyzing waves in frequency domain is called spectrum analyzer. Basically, it displays the energy distribution of a signal on its CRT screen. Here, x-axis represents frequency and y-axis represents the amplitude.
Types of Spectrum Analyzers
We can classify the spectrum analyzers into the following two types.
- Filter Bank Spectrum Analyzer
- Superheterodyne Spectrum Analyzer
Now, let us discuss about these two spectrum analyzers one by one.
Filter Bank Spectrum Analyzer
The spectrum analyzer, used for analyzing the signals are of AF range is called filter bank spectrum analyzer, or real time spectrum analyzer because it shows (displays) any variations in all input frequencies.
The following figure shows the block diagram of filter bank spectrum analyzer.
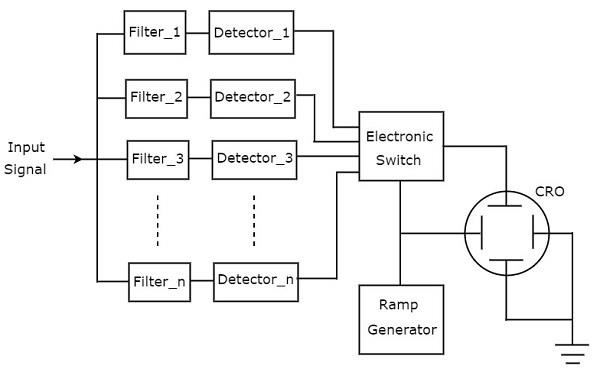
The working of filter bank spectrum analyzer is mentioned below.
It has a set of band pass filters and each one is designed for allowing a specific band of frequencies. The output of each band pass filter is given to a corresponding detector.
All the detector outputs are connected to Electronic switch. This switch allows the detector outputs sequentially to the vertical deflection plate of CRO. So, CRO displays the frequency spectrum of AF signal on its CRT screen.
Superheterodyne Spectrum Analyzer
The spectrum analyzer, used for analyzing the signals are of RF range is called superheterodyne spectrum analyzer. Its block diagram is shown in below figure.
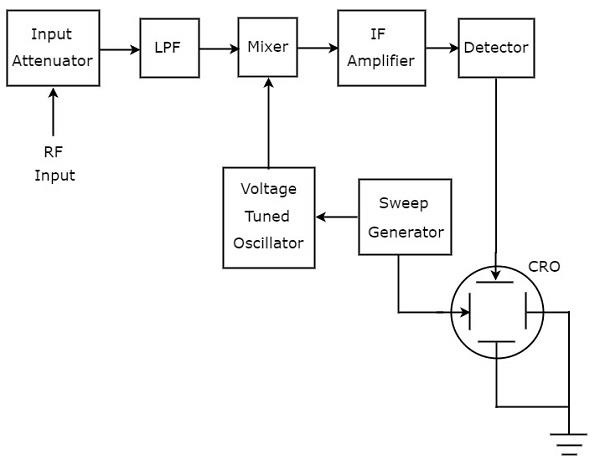
The working of superheterodyne spectrum analyzer is mentioned below.
The RF signal, which is to be analyzed is applied to input attenuator. If the signal amplitude is too large, then it can be attenuated by an input attenuator.
Low Pass Filter (LPF) allows only the frequency components that are less than the cut-off frequency.
Mixer gets the inputs from Low pass filter and voltage tuned oscillator. It produces an output, which is the difference of frequencies of the two signals that are applied to it.
IF amplifier amplifies the Intermediate Frequency (IF) signal, i.e. the output of mixer. The amplified IF signal is applied to detector.
The output of detector is given to vertical deflection plate of CRO. So, CRO displays the frequency spectrum of RF signal on its CRT screen.
So, we can choose a particular spectrum analyzer based on the frequency range of the signal that is to be analyzed.
