- Add and Subtract Whole Numbers
- Home
- Single Digit Addition
- Addition of 3 or More Single Digit Nnumbers
- Addition of Two 2-digit Numbers Without Carry
- Adding 2-digit Numbers and Single Digit Numbers
- Addition of Two 2-digit Numbers With Carry
- Addition With Carry to the Hundreds Place
- Addition of 2-digit, 3-digit and 4-digit Numbers
- Subtracting a Number From a 2-digit Number
- Subtraction of Two 2-digit Numbers Without Borrowing
- Subtraction of Two 2-digit Numbers With Borrowing
- Subtraction with Multiple Regrouping Steps
- Subtraction and Regrouping With Zeros
- Fact Families for Addition and Subtraction
- Addition or Subtraction of Whole Numbers (Word problems)
- Increasing or Decreasing Pattern from a Table of Values
Increasing or Decreasing Pattern from a Table of Values
Definition
Consider a table of values; represented by an independent variable (x) and a dependent variable (y). We often use atable of valuesto display the values we record. Using the table, we can find the relationship between the two variables and write it as a rule. There may be an increasing or decreasing pattern in the relationship between the two variables.
Example
Consider that the total cost (y) of x items is two times the no of items, i.e., y =2 x. The total cost (y) increases as the number of items (x) increase. So it is clear that there is an increasing pattern here in the values of the variables.
Problem 1
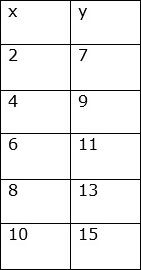
Consider the values of the variables in the table given below.
Solution
Step 1:
Consider pairs of consecutive x values and find the difference.
4 2 = 6 4 = 8 6 = 10 8 = 2
Step 2:
Similarly consider pairs of consecutive y values and see the difference.
9 7 = 11 9 = 13 11 = 15 13 = 2
Step 3:
We find that for 2-unit increase in x, there is a 2-unit increase in the y value. So we see an increasing pattern in this table of values.
Problem 2
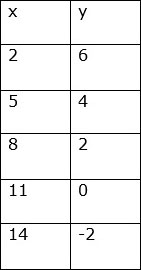
Consider the values of the variables in the table given below.
Solution
Step 1:
Consider pairs of consecutive x values and find the difference.
5 2 = 8 5 = 11 8 = 14 11= 3
Step 2:
Similarly consider pairs of consecutive y values and see the difference.
4 6 = 2 4 = 0 2 = -2 0 = - 2
Step 3:
We find that for 3-unit increase in x, there is a 2-unit decrease in the y value. So we see a decreasing pattern in this table of values.
