- Excel Power Pivot Tutorial
- Excel Power Pivot - Home
- Excel Power Pivot - Overview
- Excel Power Pivot - Installing
- Excel Power Pivot - Features
- Excel Power Pivot - Loading Data
- Excel Power Pivot - Data Model
- Power Pivot - Managing Data Model
- Excel Power Pivot Table - Creation
- Excel Power Pivot - Basics of DAX
- Power Pivot Table - Exploring Data
- Excel Power Pivot Table - Flattened
- Excel Power Pivot Charts - Creation
- Table & Chart Combinations
- Excel Power Pivot - Hierarchies
- Power Pivot - Aesthetic Reports
- Excel Power Pivot Useful Resources
- Excel Power Pivot - Quick Guide
- Excel Power Pivot - Resources
- Excel Power Pivot - Discussion
Excel Power Pivot - Installing
Power Pivot in Excel provides a Data Model connecting various different data sources based on which the data can be analyzed, visualized, and explored. The easy-to-use interface provided by Power Pivot enables a person with hands-on experience in Excel to effortlessly load data, manage the data as data tables, create relationships among the data tables, and perform the required calculations to arrive at a report.
In this chapter, you will learn, what makes Power Pivot a strong and sought after tool for analysts and decision makers.
Power Pivot on the Ribbon
The first step to proceed with Power Pivot is to ensure that the POWERPIVOT tab is available on the Ribbon. If you have Excel 2013 or later versions, the POWERPIVOT tab appears on the Ribbon.
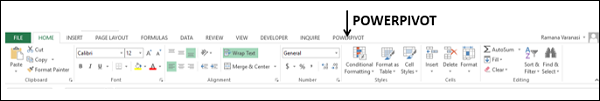
If you have Excel 2010, POWERPIVOT tab might not appear on the Ribbon if you have not already enabled the Power Pivot add-in.
Power Pivot Add-in
Power Pivot Add-in is a COM Add-in that needs to be enabled to get the complete features of Power Pivot in Excel. Even when POWERPIVOT tab appears on the ribbon, you need to ensure that the add-in is enabled to access all the features of Power Pivot.
Step 1 − Click the FILE tab on the Ribbon.
Step 2 − Click Options in the dropdown list. The Excel Options dialog box appears.
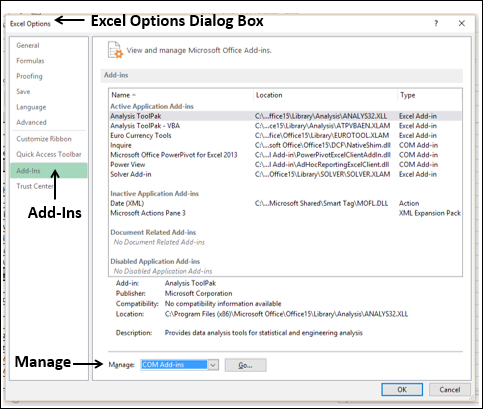
Step 3 − Follow the instructions as follows.
Click Add-Ins.
In the Manage box, select COM Add-ins from the dropdown list.
Click the Go button. The COM Add-Ins dialog box appears.
Check Power Pivot and click OK.
What is Power Pivot?
Excel Power Pivot is a tool for integrating and manipulating large volumes of data. With Power Pivot, you can easily load, sort and filter data sets that contain millions of rows and perform the required calculations. You can utilize Power Pivot as an ad hoc reporting and analytics solution.
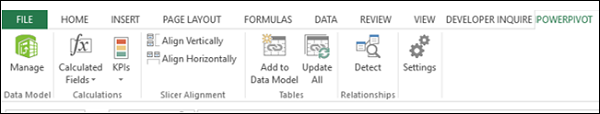
The Power Pivot Ribbon as shown below has various commands, ranging from managing Data Model to creating reports.
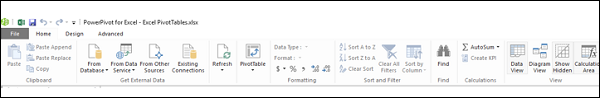
The Power Pivot window will have the Ribbon as shown below −
Why is Power Pivot a Strong Tool?
When you invoke Power Pivot, Power Pivot creates data definitions and connections that get stored with your Excel file in a compressed form. When the data at the source is updated, it is refreshed automatically in your Excel file. This facilitates the usage of the data maintained elsewhere but is required for study time-to-time study and arriving at decisions. The source data can be in any form − ranging from a text file or a web page to the different relational databases.
The user-friendly interface of Power Pivot in the PowerPivot window enables you to perform data operations without the knowledge of any database query language. You can then create a report of your analysis within few seconds. The reports are versatile, dynamic and interactive and enable you to further probe into the data to get the insights and arrive at the conclusions / decisions.
The data that you work on in Excel and in the Power Pivot window is stored in an analytical database inside the Excel workbook, and a powerful local engine loads, queries, and updates the data in that database. Since the data is in Excel, it is immediately available to PivotTables, PivotCharts, Power View, and other features in Excel that you use to aggregate and interact with the data. The data presentation and interactivity is provided by Excel and the data and Excel presentation objects are contained within the same workbook file. Power Pivot supports files up to 2GB in size and enables you to work with up to 4GB of data in memory.
Power Features to Excel with Power Pivot
Power Pivot features are free with Excel. Power Pivot has enhanced the Excel performance with power features that include the following −
Ability to handle large data volumes, compressed into small files, with amazing speed.
Filter data and rename columns and tables while importing.
Organize tables into individual tabbed pages in the Power Pivot window as against the Excel tables distributed all over the workbook or multiple tables in the same worksheet.
Create relationships among the tables, so as to analyze the data in the tables collectively. Before Power Pivot, one had to rely on heavy usage of VLOOKUP function to combine the data into a single table before such analysis. This used to be laborious and error-prone.
Add power to the simple PivotTable with many added features.
Provide Data Analysis Expressions (DAX) language to write advanced formulas.
Add calculated fields and calculated columns to the data tables.
Create KPIs to use in PivotTables and Power View reports.
You will understand the Power Pivot features in detail in the next chapter.
Uses of Power Pivot
You can use Power Pivot for the following −
To perform powerful data analysis and create sophisticated Data Models.
To mash-up large volumes of data from several different sources quickly.
To perform information analysis and share the insights interactively.
To write advanced formulas with the Data Analysis Expressions (DAX) language.
To create Key Performance Indicators (KPIs).
Data Modelling with Power Pivot
Power Pivot provides advanced data modeling features in Excel. The data in the Power Pivot is managed in the Data Model that is also referenced as Power Pivot database. You can use Power Pivot to help you gain new insights into your data.
You can create relationships between data tables so that you can perform data analysis on the tables collectively. With DAX, you can write advanced formulas. You can create calculated fields and calculated columns in the data tables in the Data Model.
You can define Hierarchies in the data to use everywhere in the workbook, including Power View. You can create KPIs to use in PivotTables and Power View reports to show at a glance whether performance is on or off target for one or more metrics.
Business Intelligence with Power Pivot
Business intelligence (BI) is essentially the set of tools and processes that people use to gather data, turn it into meaningful information, and then make better decisions. The BI capabilities of Power Pivot in Excel enable you to gather data, visualize data, and share information with people in your organization across multiple devices.
You can share your workbook to a SharePoint environment that has Excel Services enabled. On the SharePoint server, Excel Services processes and renders the data in a browser window where others can analyze the data.