- Excel Power Pivot Tutorial
- Excel Power Pivot - Home
- Excel Power Pivot - Overview
- Excel Power Pivot - Installing
- Excel Power Pivot - Features
- Excel Power Pivot - Loading Data
- Excel Power Pivot - Data Model
- Power Pivot - Managing Data Model
- Excel Power Pivot Table - Creation
- Excel Power Pivot - Basics of DAX
- Power Pivot Table - Exploring Data
- Excel Power Pivot Table - Flattened
- Excel Power Pivot Charts - Creation
- Table & Chart Combinations
- Excel Power Pivot - Hierarchies
- Power Pivot - Aesthetic Reports
- Excel Power Pivot Useful Resources
- Excel Power Pivot - Quick Guide
- Excel Power Pivot - Resources
- Excel Power Pivot - Discussion
Excel Power Pivot - Hierarchies
A hierarchy in Data Model is a list of nested columns in a data table that are considered as a single item when used in a Power PivotTable. For example, if you have the columns − Country, State, City in a data table, a hierarchy can be defined to combine the three columns into one field.
In the Power PivotTable Fields list, the hierarchy appears as one field. So, you can add just one field to the PivotTable, instead of the three fields in the hierarchy. Further, it enables you to move up or down the nested levels in a meaningful way.
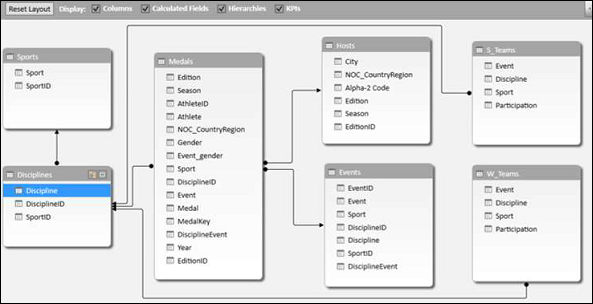
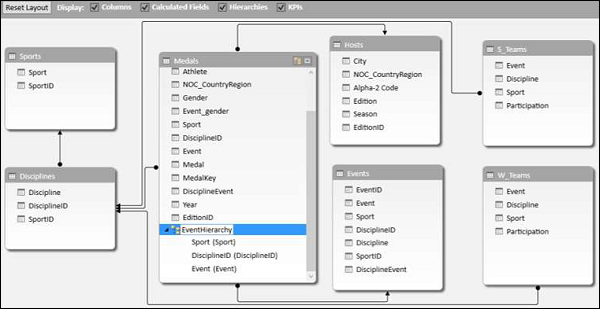
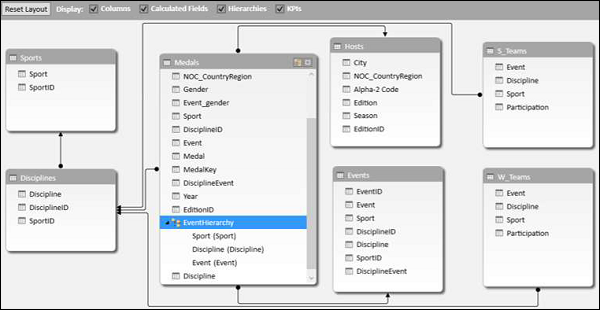
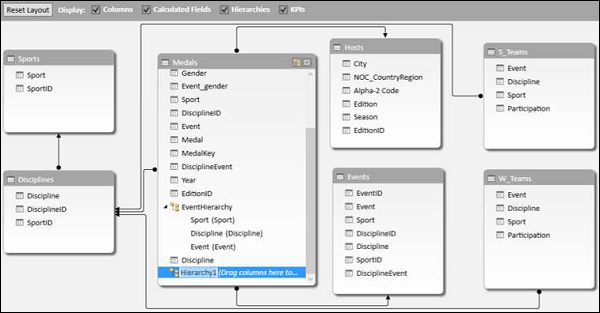
Consider the following Data Model for illustrations in this chapter.
Creating a Hierarchy
You can create Hierarchies in the diagram view of the Data Model. Note that you can create a hierarchy based on a single data table only.
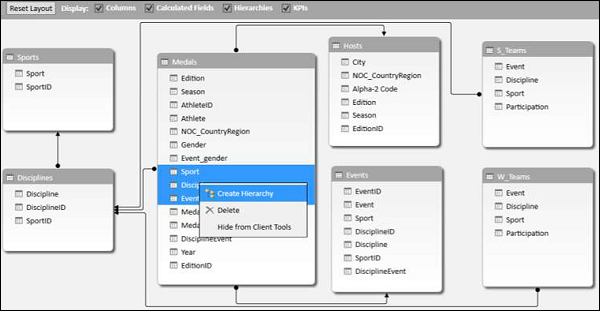
Click on the columns − Sport, DisciplineID and Event in the data table Medal in that order. Remember that the order is important to create a meaningful hierarchy.
Right-click on the selection.
Select Create Hierarchy from the dropdown list.
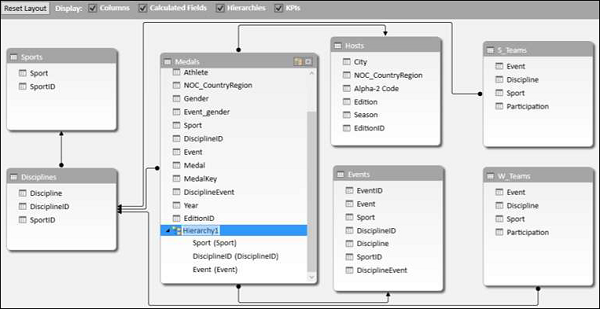
The hierarchy field with the three selected fields as the child levels gets created.
Renaming a Hierarchy
To rename the hierarchy field, do the following −
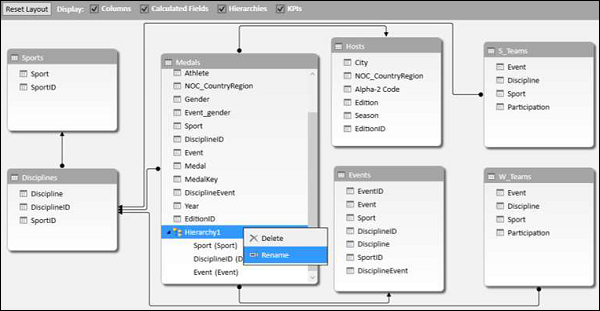
Right click on Hierarchy1.
Select Rename from the dropdown list.
Type EventHierarchy.
Creating a PivotTable with a Hierarchy in Data Model
You can create a Power PivotTable using the hierarchy that you created in the Data Model.
Click the PivotTable tab on the Ribbon in the Power Pivot window.
Click PivotTable on the Ribbon.
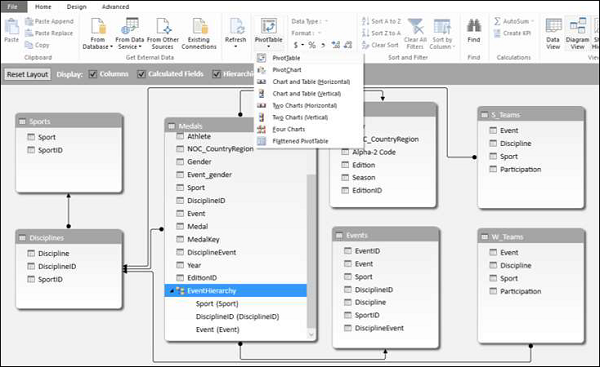
The Create PivotTable dialog box appears. Select New Worksheet and click OK.
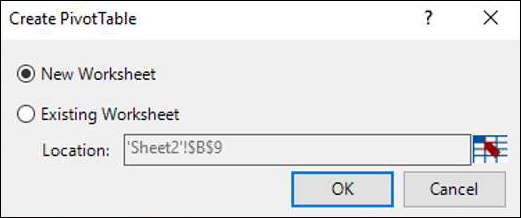
An empty PivotTable is created in a new worksheet.
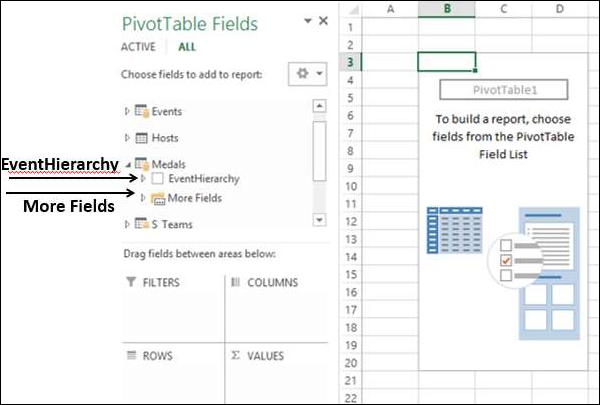
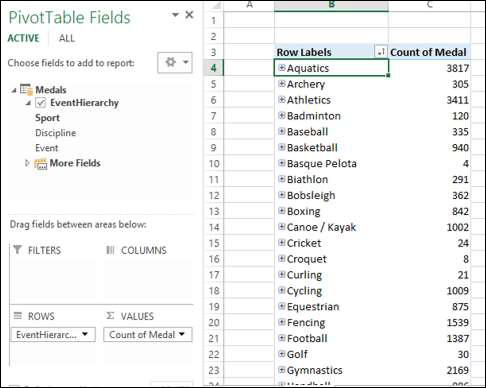
In the PivotTable Fields list, EventHierarchy appears as a field in Medals table. The other fields in the Medals table are collapsed and shown as More Fields.
Click on the arrow
 in front of EventHierarchy.
Click on the arrow
in front of More Fields.
The fields under EventHierarchy will be displayed. All the fields in the Medals table will be displayed under More Fields.
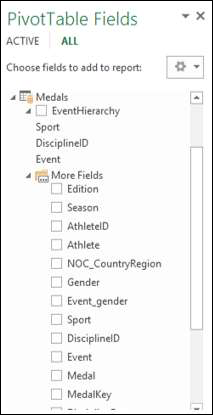
As you can observe, the three fields that you added to the hierarchy also appear under More Fields with check boxes. If you do not want them to appear in the PivotTable Fields list under More Fields, you have to hide the columns in the data table – Medals in data view in Power Pivot Window. You can always unhide them whenever you want.
Add fields to the PivotTable as follows −
Drag EventHierarchy to ROWS area.
Drag Medal to ∑ VALUES area.
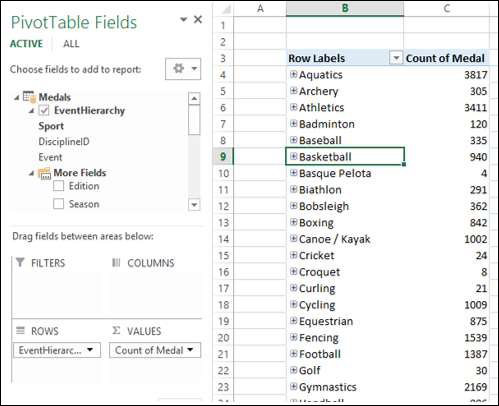
The values of Sport field appear in the PivotTable with a + sign in front of them. The medal count for each sport is displayed.
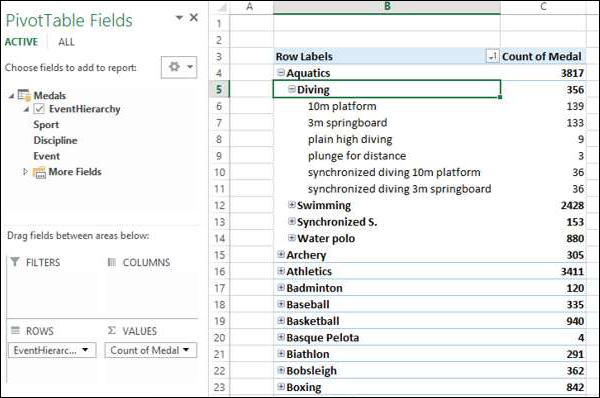
Click on the + sign before Aquatics. The DisciplineID field values under Aquatics will be displayed.
Click on the child D22 that appears. The Event field values under D22 will be displayed.
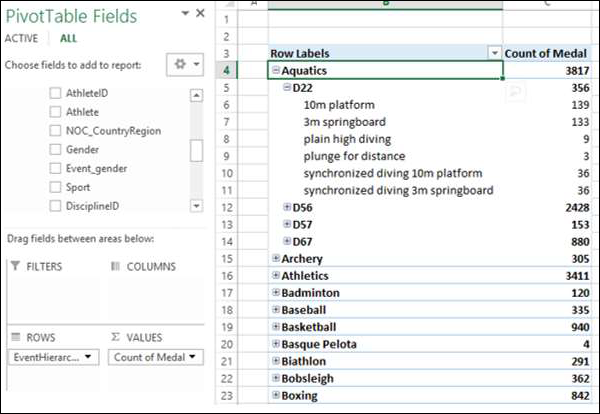
As you can observe, medal count is given for the Events, that get summed up at the parent level − DisciplineID, that get further summed up at the parent level − Sport.
Creating a Hierarchy based on Multiple Tables
Suppose you want to display the Disciplines in the PivotTable rather than DisciplineIDs to make it a more readable and understandable summarization. In order to do this, you need to have the field Discipline in Medals table that as you know is not. Discipline field is in Disciplines data table, but you cannot create a hierarchy with fields from more than one table. But, there is a way to obtain the required field from the other table.
As you are aware, the tables − Medals and Disciplines are related. You can add the field Discipline from Disciplines table to the Medals table, by creating a column using the relationship with DAX.
Click data view in Power Pivot window.
Click the Design tab on the Ribbon.
Click Add.
The column − Add Column on the right side of the table is highlighted.
Type = RELATED (Disciplines [Discipline]) in the formula bar. A new column − CalculatedColumn1 is created with the values as Discipline field values in the Disciplines table.
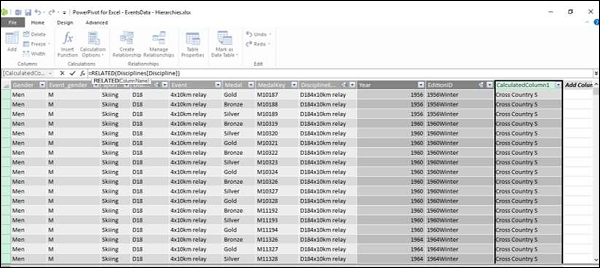
Rename the new column thus obtained in the Medals table as Discipline. Next, you have to remove DisciplineID from the Hierarchy and add Discipline, which you will learn in the following sections.
Removing a Child Level from a Hierarchy
As you can observe, the hierarchy is visible in the diagram view only, and not in the data view. Hence, you can edit a hierarchy in the diagram view only.
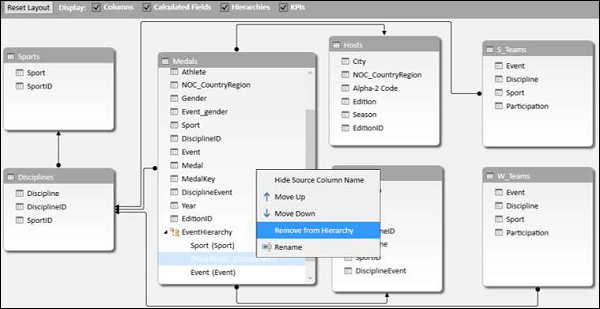
Click on the diagram view in the Power Pivot window.
Right click DisciplineID in EventHierarchy.
Select Remove from Hierarchy from the dropdown list.
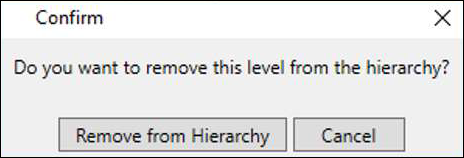
The Confirm dialog box appears. Click Remove from Hierarchy.
The field DisciplineID gets deleted from the hierarchy. Remember that you have removed the field from hierarchy, but the source field still exists in the data table.
Next, you need to add Discipline field to EventHierarchy.
Adding a Child Level to a Hierarchy
You can add the field Discipline to the existing hierarchy - EventHierarchy as follows −
Click on the field in Medals table.
Drag it to the Events field below in the EventHierarchy.
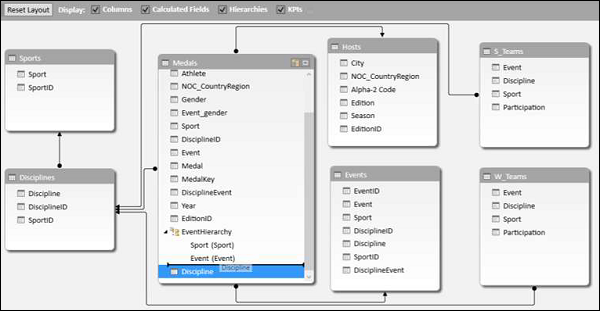
The Discipline field gets added to EventHierarchy.

As you can observe, the order of the fields in EventHierarchy is Sport–Event–Discipline. But, as you are aware it has to be Sport–Discipline-Event. Hence, you need to change the order of the fields.
Changing the Order of a Child Level in a Hierarchy
To move the field Discipline to the position after the field Sport, do the following −
Right click on the field Discipline in EventHierarchy.
Select Move Up from the dropdown list.
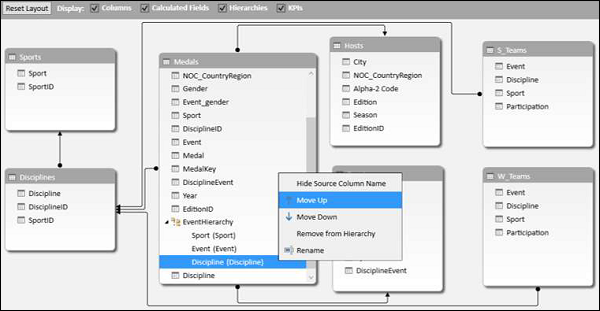
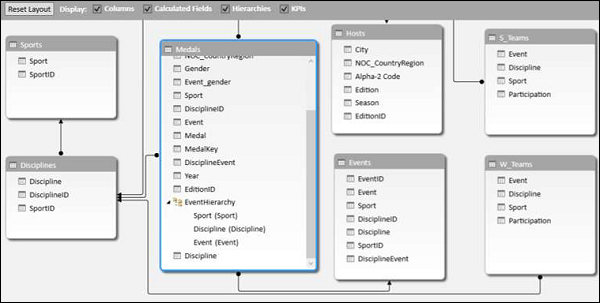
The order of the fields changes to Sport-Discipline-Event.
PivotTable with Changes in Hierarchy
To view the changes that you made in EventHierarchy in the PivotTable, you need not create a new PivotTable. You can view them in the existing PivotTable itself.
Click on the worksheet with the PivotTable in Excel window.
As you can observe, in the PivotTable Fields list, the child levels in the EventHierarchy reflect the changes you made in the Hierarchy in Data Model. The same changes also get reflected in the PivotTable accordingly.
Click the + sign in front of Aquatics in the PivotTable. The child levels appear as values of the field Discipline.
Hiding and Showing Hierarchies
You can choose to hide the Hierarchies and show them whenever you want.
Uncheck the box Hierarchies in the top menu of diagram view to hide the hierarchies.
Check the box Hierarchies to show the hierarchies.

Creating a Hierarchy in Other Ways
In addition to the way you created hierarchy in the previous sections, you can create a hierarchy in another two ways.
1. Click the Create Hierarchy button on the top right corner of the Medals data table in diagram view.
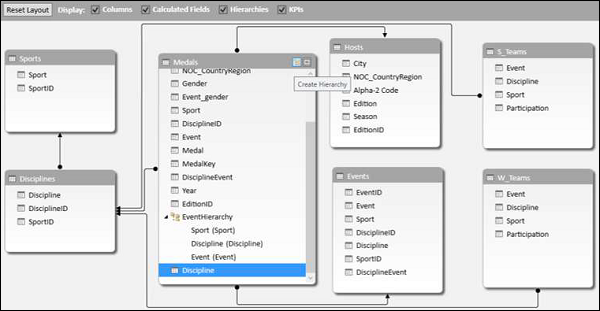
A new hierarchy gets created in the table without any fields in it.
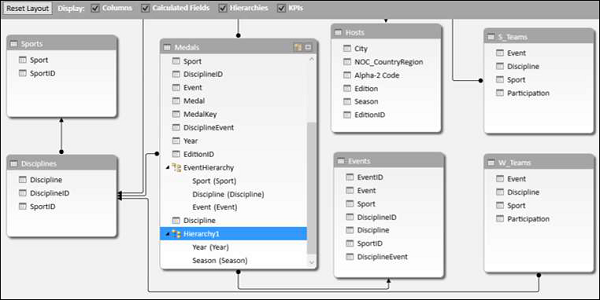
Drag the fields Year and Season, in that order to the new hierarchy. The hierarchy shows the child levels.
2. Another way of creating the same hierarchy is as follows −
Right click on the field Year in the Medals data table in diagram view.
Select Create Hierarchy from the dropdown list.
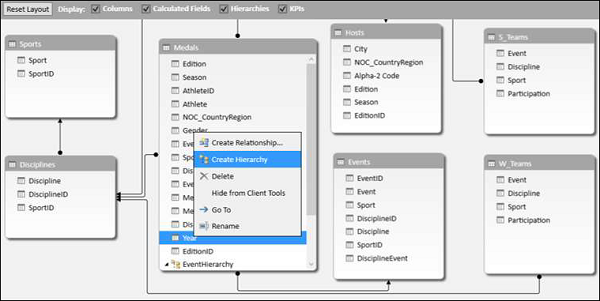
A new hierarchy is created in table with Year as a child field.
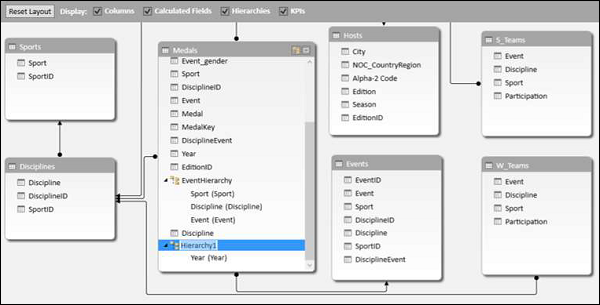
Drag the field season to the hierarchy. The hierarchy shows the child levels.

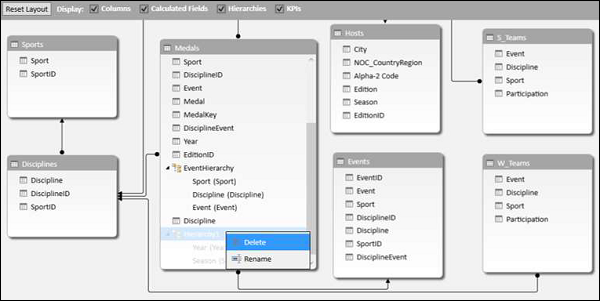
Deleting a Hierarchy
You can delete a hierarchy from the Data Model as follows −
Right click on the hierarchy.
Select Delete from the dropdown list.
The Confirm dialog box appears. Click Delete from Model.
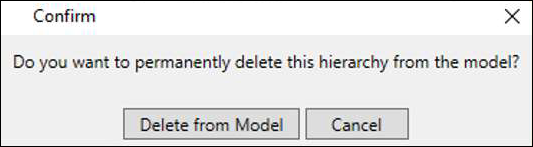
The hierarchy gets deleted.
Calculations Using Hierarchy
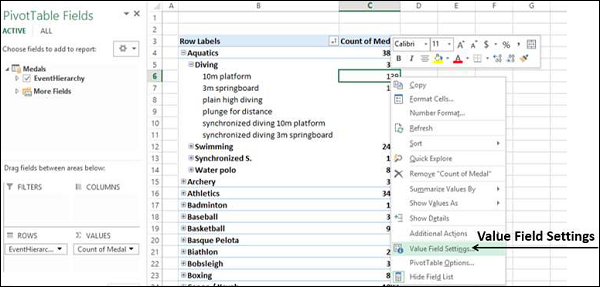
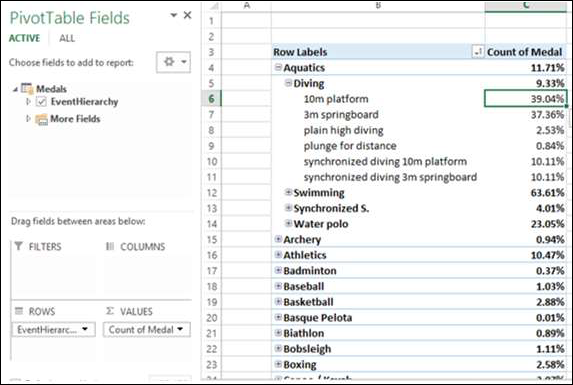
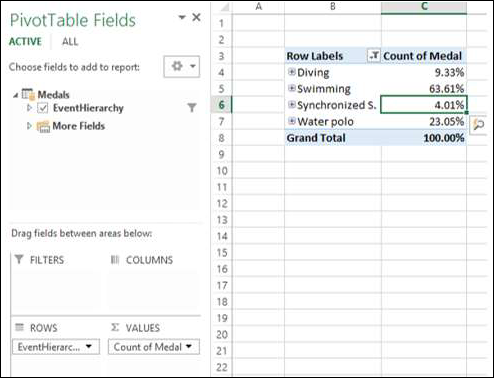
You can create calculations using a hierarchy. In the EventsHierarchy, you can display the number of medals at a child level as a percentage of the number of medals at its parent level as follows −
Right click on a Count of Medal value of an Event.
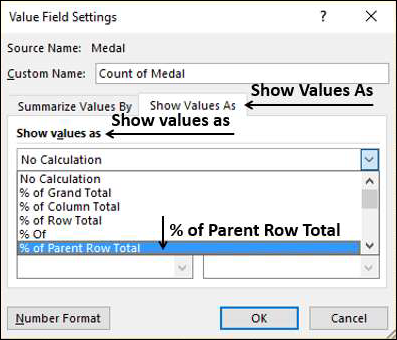
Select Value Field Settings from the dropdown list.
Value Field Settings dialog box appears.
Click the Show Values As tab.
Select % of Parent Row Total from the list and click OK.
The child levels are displayed as the percentage of the Parent Totals. You can verify this by summing up the percentage values of the child level of a parent. The sum would be 100%.
Drilling Up and Drilling Down a Hierarchy
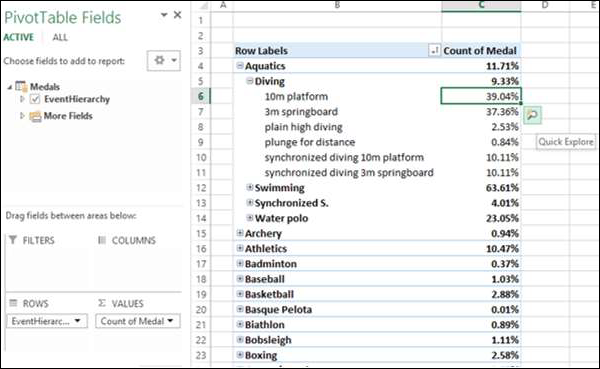
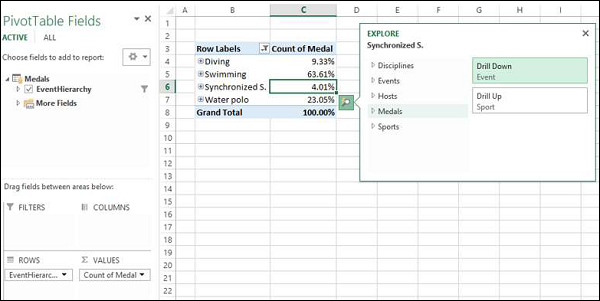
You can quickly drill up and drill down across the levels in a hierarchy using Quick Explore tool.
Click on a value of Event field in the PivotTable.
Click the Quick Explore tool -
 that appears at the bottom right corner of the cell containing the selected value.
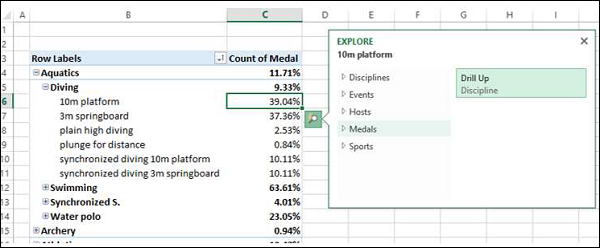
The Explore box with Drill Up option appears. This is because from Event you can only drill up as there are no child levels under it.
Click Drill Up.
PivotTable data is drilled up to Discipline.
Click on the Quick Explore tool - that appears at the bottom right corner of the cell containing a value.
Explore box appears with Drill Up and Drill Down options displayed. This is because from Discipline you can drill up to Sport or drill down to Event.
This way you can quickly move up and down the hierarchy.