- Excel Power Pivot Tutorial
- Excel Power Pivot - Home
- Excel Power Pivot - Overview
- Excel Power Pivot - Installing
- Excel Power Pivot - Features
- Excel Power Pivot - Loading Data
- Excel Power Pivot - Data Model
- Power Pivot - Managing Data Model
- Excel Power Pivot Table - Creation
- Excel Power Pivot - Basics of DAX
- Power Pivot Table - Exploring Data
- Excel Power Pivot Table - Flattened
- Excel Power Pivot Charts - Creation
- Table & Chart Combinations
- Excel Power Pivot - Hierarchies
- Power Pivot - Aesthetic Reports
- Excel Power Pivot Useful Resources
- Excel Power Pivot - Quick Guide
- Excel Power Pivot - Resources
- Excel Power Pivot - Discussion
Excel Power Pivot - Exploring Data
In the previous chapter, you have learnt how to create a Power PivotTable from a normal set of data tables. In this chapter, you will learn how you can explore data with Power PivotTable, when the data tables contain thousands of rows.
For a better understanding, we will import the data from an access database, which you know is a relational database.
Loading Data from Access Database
To load data from the Access database, follow the given steps −
Open a new blank workbook in Excel.
Click Manage in the Data Model group.
Click the POWERPIVOT tab on the Ribbon.
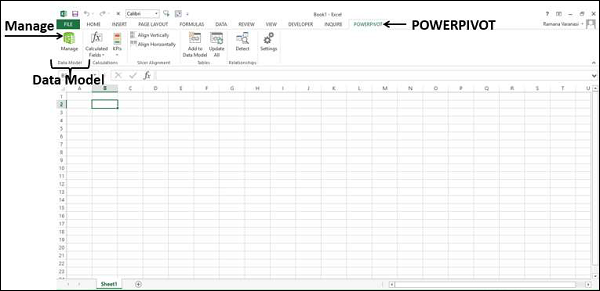
The Power Pivot window appears.
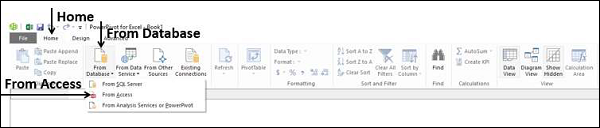
Click the Home tab in the Power Pivot window.
Click From Database in the Get External Data group.
Select From Access from the dropdown list.
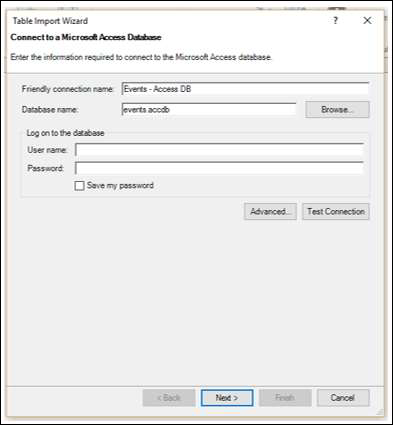
The Table Import Wizard appears.
Provide Friendly connection name.
Browse to the Access database file, Events.accdb, the Events database file.
Click on the Next > button.
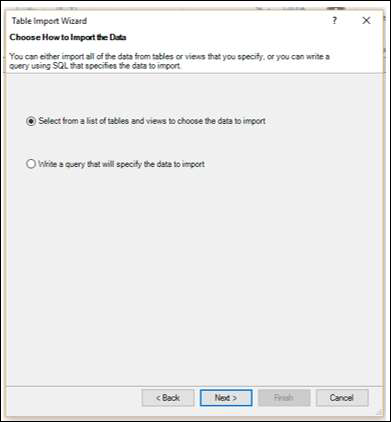
The Table Import wizard displays options for choosing how to import data.
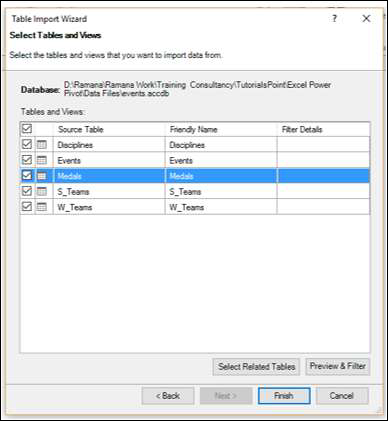
Click Select from a list of tables and views to choose the data to import and click Next.
The Table Import Wizard displays all the tables in the Access database that you have selected. Check all the boxes to select all the tables and click Finish.
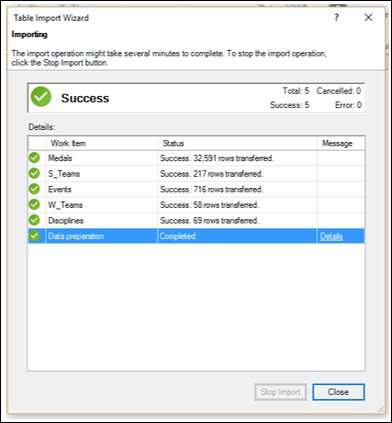
The Table Import Wizard displays – Importing and shows the status of the import. This may take a few minutes and you can stop the import by clicking the Stop Import button.
Once the data import is complete, Table Import Wizard displays – Success and shows the results of the import. Click Close.
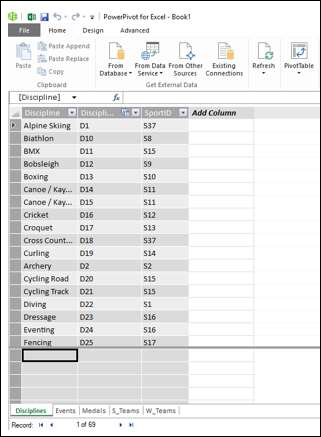
Power Pivot displays all the imported tables in different tabs in Data View.
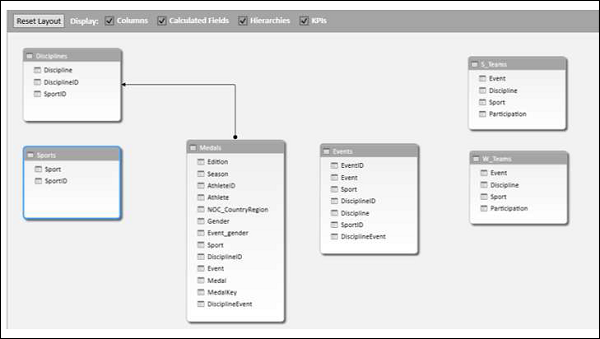
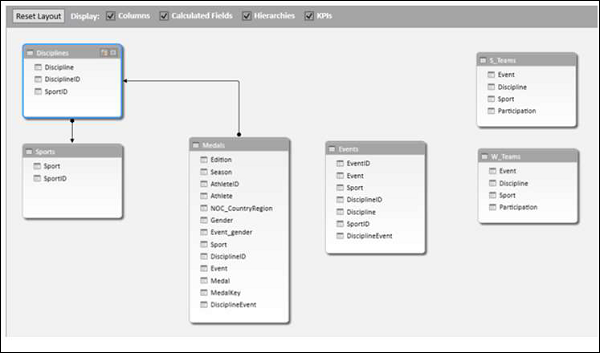
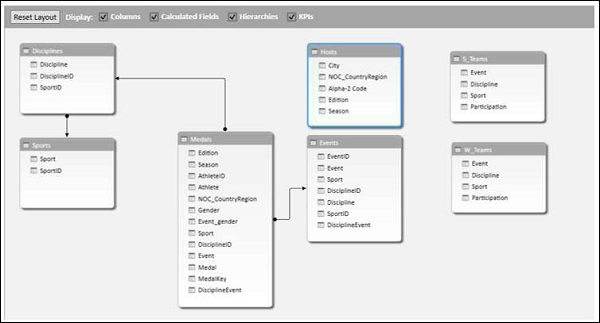
Click on the Diagram View.
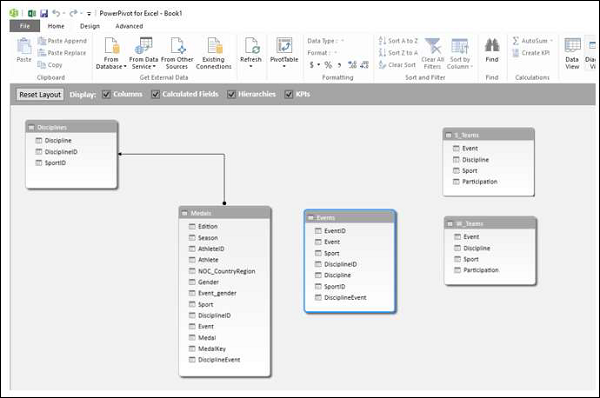
You can observe that a relationship exists between the tables – Disciplines and Medals. This is because, when you import data from a relational database such as Access, the relationships that exist in the database also are imported to the Data Model in Power Pivot.
Creating a PivotTable from the Data Model
Create a PivotTable with the tables that you have imported in the previous section as follows −
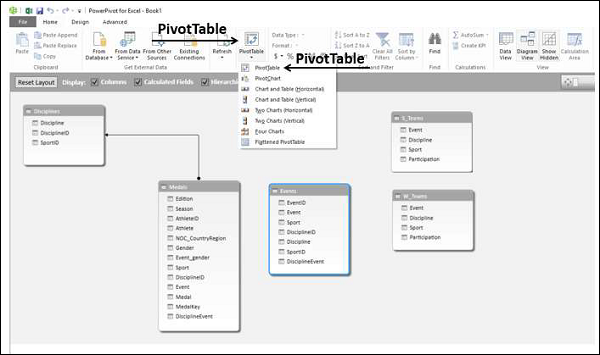
Click PivotTable on the Ribbon.
Select PivotTable from the drop down list.
Select New Worksheet in the Create PivotTable dialog box that appears and click OK.
An empty PivotTable is created in a new worksheet in the Excel window.
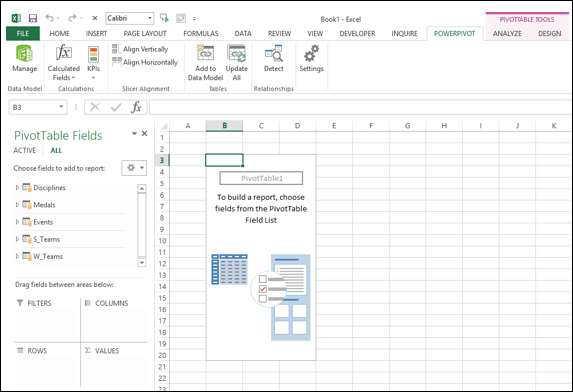
All the imported tables that are a part of Power Pivot Data Model appear in the PivotTable Fields list.
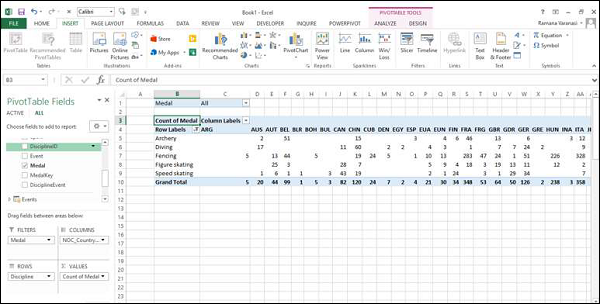
Drag the NOC_CountryRegion field in the Medals table to the COLUMNS area.
Drag Discipline from the Disciplines table to the ROWS area.
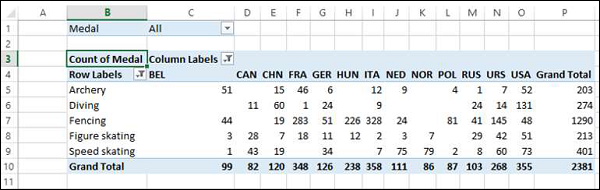
Filter Discipline to display only five sports: Archery, Diving, Fencing, Figure Skating, and Speed Skating. This can be done either in PivotTable Fields area, or from the Row Labels filter in the PivotTable itself.
Drag Medal from the Medals table to the VALUES area.
Select Medal from the Medals table again and drag it into the FILTERS area.
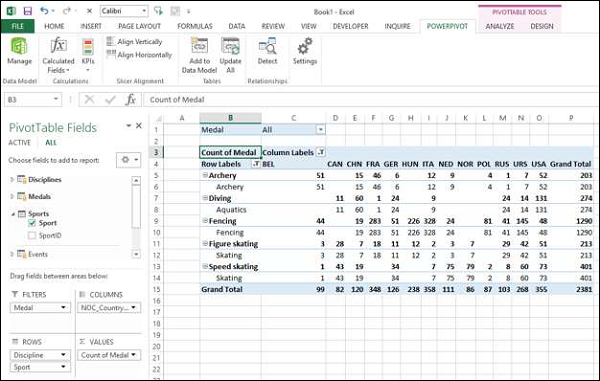
The PivotTable is populated with the added fields and in the chosen layout from the areas.
Exploring Data with PivotTable
You might want to display only those values with Medal Count > 80. To perform this, follow the given steps −
Click the arrow to the right of Column Labels.
Select Value Filters from the dropdown list.
Select Greater Than…. from the second dropdown list.
Click OK.
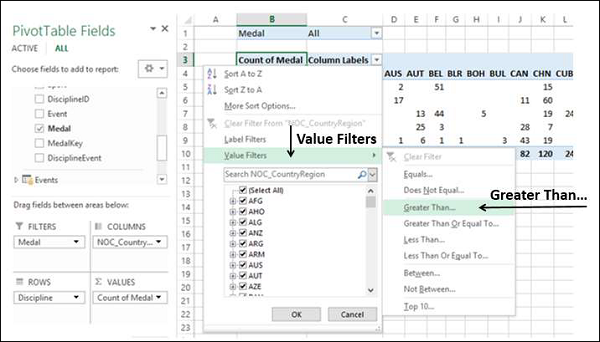
The Value Filter dialog box appears. Type 80 in the right-most box and click OK.
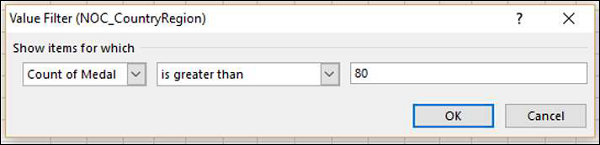
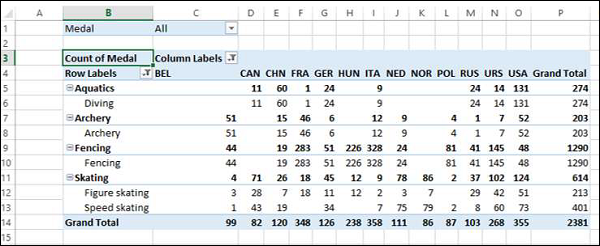
The PivotTable displays only those regions with total number of medals more than 80.
You could arrive at the specific report that you wanted from the different tables in just few steps. This became possible because of the pre-existing relationships among the tables in the Access database. As you imported all the tables from the database together at the same time, Power Pivot recreated the relationships in its Data Model.
Summarizing Data from Different Sources in Power Pivot
If you get the data tables from different sources or if you do not import the tables from a database at the same time, or if you create new Excel tables in your workbook and add them to the Data Model, you have to create the relationships among the tables that you want to use for your analysis and summarization in the PivotTable.
Create a new worksheet in the workbook.
Create an Excel table – Sports.
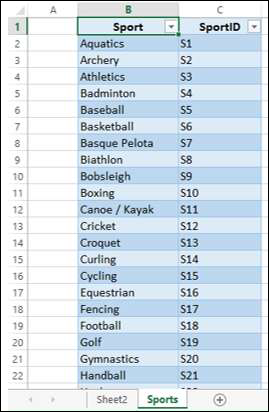
Add Sports table to Data Model.
Create a relationship between the tables Disciplines and Sports with the field SportID.
Add the field Sport to the PivotTable.
Shuffle the fields - Discipline and Sport in the ROWS area.
Extending Data Exploration
You can get the table Events also into further data exploration.
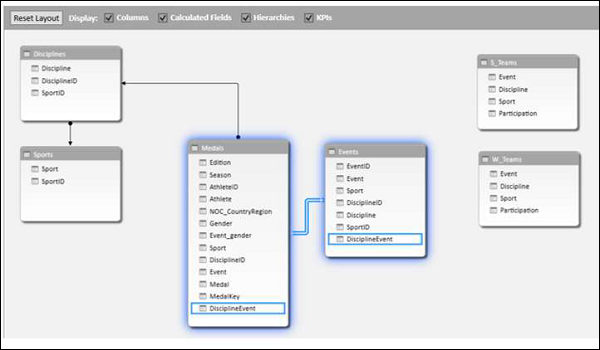
Create a relationship between the tables- Events and Medals with the field DisciplineEvent.
Add a table Hosts to the workbook and Data Model.
Extending the Data Model using Calculated Columns
To connect Hosts table to any of the other tables, it should have a field with values that uniquely identify each row in the Hosts table. As no such field exists in the Host table, you can create a calculated column in the Hosts table so that it contains unique values.
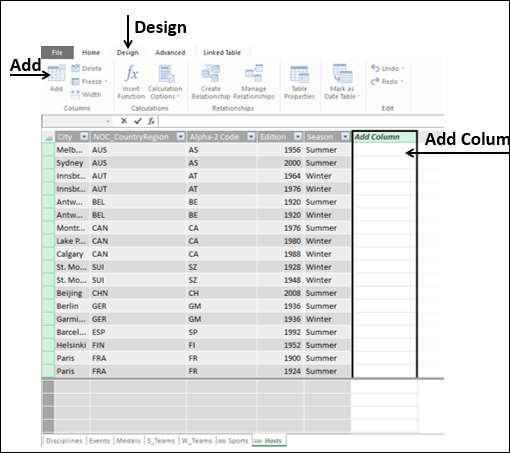
Go to the Hosts table in Data View of the PowerPivot window.
Click the Design tab on the Ribbon.
Click Add.
The right-most column with the header Add Column is highlighted.
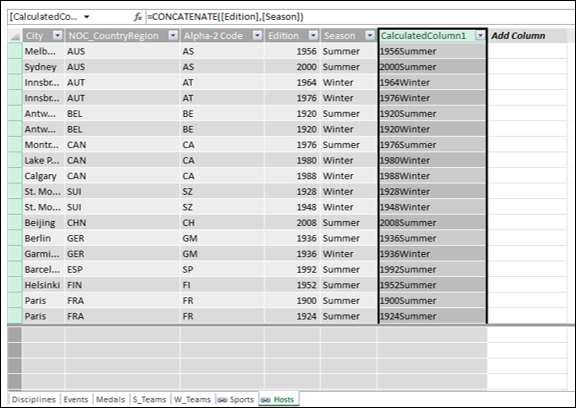
Type the following DAX formula in the formula bar = CONCATENATE ([Edition], [Season])
Press Enter.
A new column is created with the header CalculatedColumn1 and the column is filled by the values resulting from the above DAX formula.
Right-click on the new column and select Rename Column from the dropdown list.
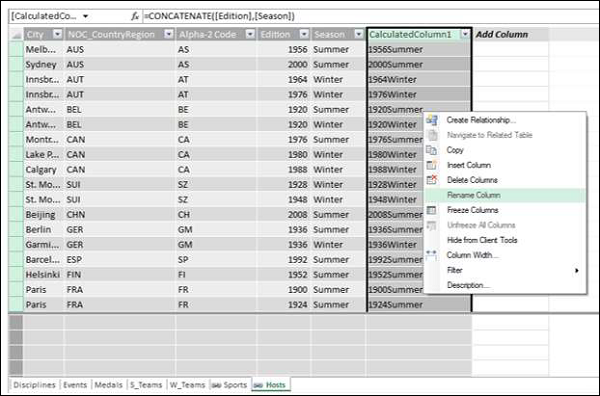
Type EditionID in the header of the new column.
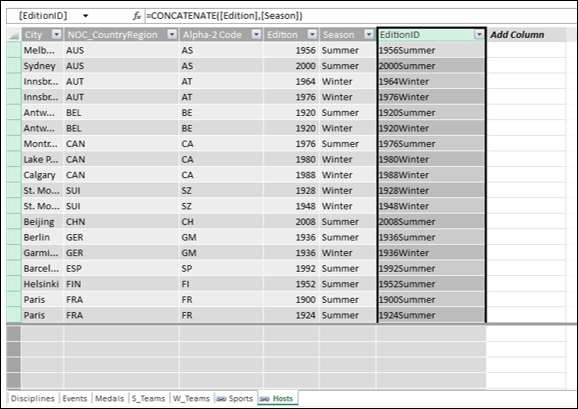
As you can see, the column EditionID has unique values in the Hosts table.
Creating a Relationship Using Calculated Columns
If you have to create a relationship between the Hosts table and the Medals table, the column EditionID should exist in the Medals table also. Create a calculated column in Medals table as follows −
Click on the Medals table in the Data View of Power Pivot.
Click the Design tab on the Ribbon.
Click Add.
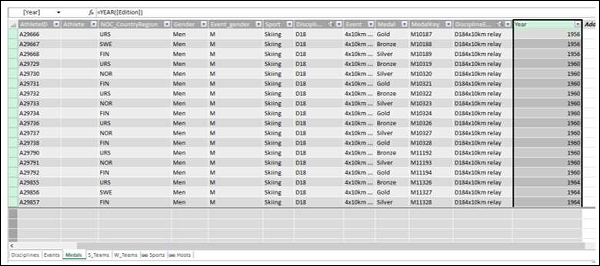
Type the DAX formula in the formula bar = YEAR ([EDITION]) and press Enter.
Rename the new column that is created as Year and click Add.
Type the following DAX formula in the formula bar = CONCATENATE ([Year], [Season])
Rename the new column that is created as EditionID.
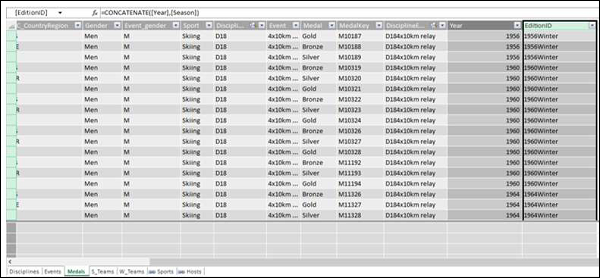
As you can observe, the EditionID column in the Medals table has identical values as the EditionID column in the Hosts table. Therefore, you can create a relationship between the tables – Medals and Sports with the EditionID field.
Switch to the diagram view in PowerPivot window.
Create a relationship between the tables- Medals and Hosts with the field that is obtained from the calculated column i.e. EditionID.
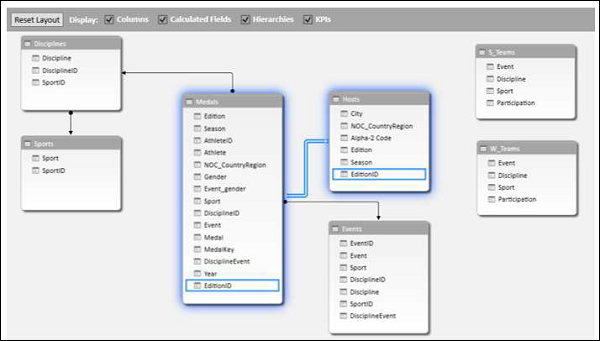
Now you can add fields from Hosts table to Power PivotTable.