- Excel Power Pivot Tutorial
- Excel Power Pivot - Home
- Excel Power Pivot - Overview
- Excel Power Pivot - Installing
- Excel Power Pivot - Features
- Excel Power Pivot - Loading Data
- Excel Power Pivot - Data Model
- Power Pivot - Managing Data Model
- Excel Power Pivot Table - Creation
- Excel Power Pivot - Basics of DAX
- Power Pivot Table - Exploring Data
- Excel Power Pivot Table - Flattened
- Excel Power Pivot Charts - Creation
- Table & Chart Combinations
- Excel Power Pivot - Hierarchies
- Power Pivot - Aesthetic Reports
- Excel Power Pivot Useful Resources
- Excel Power Pivot - Quick Guide
- Excel Power Pivot - Resources
- Excel Power Pivot - Discussion
Excel Power Pivot - Data Model
A Data Model is a new approach introduced in Excel 2013 for integrating data from multiple tables, effectively building a relational data source inside an Excel workbook. Within Excel, Data Model is used transparently, providing tabular data used in PivotTables and PivotCharts. In Excel, you can access the tables and their corresponding values through the PivotTable / PivotChart Field lists that contain the table names and corresponding fields.
The main use of Data Model in Excel is its usage by Power Pivot. Data Model can be considered as the Power Pivot database, and all the power features of Power Pivot are managed with the Data Model. All data operations with Power Pivot are explicit in nature and can be visualized in the Data Model.
In this chapter, you will understand the Data Model in detail.
Excel and Data Model
There will be only one Data Model in an Excel workbook. When you work with Excel, Data Model usage is implicit. You cannot directly access the Data Model. You can only see the multiple tables in the Data Model in the Fields list of PivotTable or PivotChart and use them. Creating the Data Model and adding data is also done implicitly in Excel, while you are getting external data into Excel.
If you want to look at the Data Model, you can do so as follows −
Click the POWERPIVOT tab on the Ribbon.
Click Manage.
Data Model, if exists in the workbook, will be displayed as tables, each one with a tab.
Note − If you add an Excel table to Data Model, you will not transform the Excel table into a data table. A copy of the Excel table is added as a data table in the Data Model and a link is created between the two. Hence, if changes are done in the Excel table, the data table also is updated. However, from the storage point of view, there are two tables.
Power Pivot and Data Model
Data Model is inherently the database for Power Pivot. Even when you create the Data Model from Excel, it builds the Power Pivot database only. Creating the Data Model and/or adding data is done explicitly in Power Pivot.
In fact, you can manage the Data Model from Power Pivot window. You can add data to Data Model, import data from different data sources, view the Data Model, create relationships between the tables, create calculated fields and calculated columns, etc.
Creating a Data Model
You can either add tables to the Data Model from Excel or you can directly import data into Power Pivot, thus creating the Power Pivot Data Model tables. You can view the Data Model by clicking Manage in the Power Pivot window.
You will understand how to add tables from Excel to the Data Model in the chapter – Loading Data through Excel. You will understand how to load data into Data Model in the chapter – Loading Data into Power Pivot.
Tables in Data Model
Tables in Data Model can be defined as a set of tables holding relationships across them. The relationships enable combining related data from different tables for analysis and reporting purposes.
The tables in the Data Model are called Data Tables.
A table in the Data Model is considered as a set of records (a record is a row) made up of fields (a field is a column). You cannot edit individual items in a data table. However, you can append rows or add calculated columns to the data table.
Excel Tables and Data Tables
Excel tables are just a collection of separate tables. There can be multiple tables on a worksheet. Each table can be accessed separately, but it is not possible to access data from more than one Excel table at the same time. This is the reason that when you create a PivotTable, it is based on only one table. If you need to use the data from two Excel tables collectively, you need to first merge them into a single Excel table.
A data table on the other hand coexists with other data tables with relationships, facilitating the combination of data from multiple tables. Data tables get created when you import data into Power Pivot. You can also add Excel tables to the Data Model while you are creating a Pivot Table getting external data or from multiple tables.
The data tables in the Data Model can be viewed in two ways −
Data View.
Diagram View.
Data View of Data Model
In the data view of the Data Model, each data table exists on a separate tab. The data table rows are the records and columns represent the fields. The tabs contain the table names and the column headers are the fields in that table. You can do calculations in the data view using the Data Analysis Expressions (DAX) language.
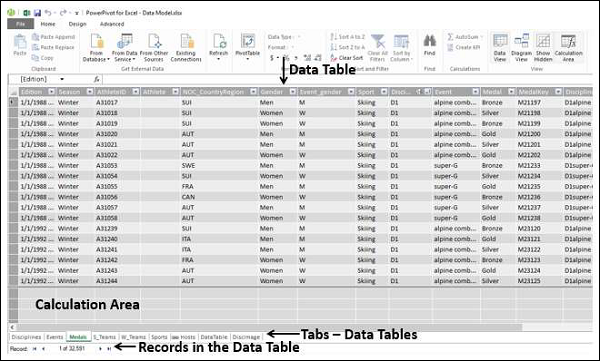
Diagram View of Data Model
In the diagram view of the Data Model, all the data tables are represented by boxes with the table names and contain the fields in the table. You can arrange the tables in the diagram view by just dragging them. You can adjust the size of a data table so that all the fields in the table are displayed.
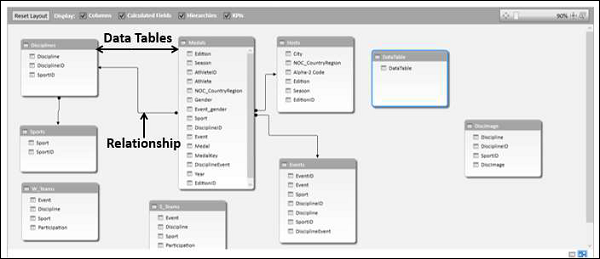
Relationships in Data Model
You can view the relationships in the diagram view. If two tables have a relationship defined between them, an arrow connecting the source table to the target table appears. If you want to know which fields are used in the relationship, just double click the arrow. The arrow and the two fields in the two tables are highlighted.
Table relationships will be created automatically if you import related tables that have primary and foreign key relationships. Excel can use the imported relationship information as the basis for table relationships in the Data Model.
You can also explicitly create relationships in either of the two views −
Data View − Using Create Relationship dialog box.
Diagram View − By clicking and dragging to connect the two tables.
Create Relationship Dialog Box
In a relationship, four entities are involved −
Table − The data table from which the relationship starts.
Column − The field in the Table that is also present in the related table.
Related Table − The data table where the relationship ends.
Related Column − The field in the related table that is same as the field represented by Column in Table. Note that the values of Related Column should be unique.
In the diagram view, you can create the relationship by clicking on the field in the table and dragging to the related table.
You will learn more about relationships in the chapter - Managing Data Tables and Relationships with Power Pivot.