- DC.js Tutorial
- DC.js - Home
- DC.js - Introduction
- DC.js - Installation
- DC.js - Concepts
- Introduction to Crossfilter
- Introduction to D3.js
- DC.js - Mixins
- DC.js - baseMixin
- DC.js - capMixin
- DC.js - colorMixin
- DC.js - marginMixin
- DC.js - coordinateGridMixin
- DC.js - Pie Chart
- DC.js - Line Chart
- DC.js - Bar Chart
- DC.js - Composite Chart
- DC.js - Series Chart
- DC.js - Scatter Plot
- DC.js - Bubble Chart
- DC.js - Heat Map
- DC.js - Data Count
- DC.js - Data Table
- DC.js - Data Grid
- DC.js - Legend
- DC.js - Dashboard Working Example
- DC.js Useful Resources
- DC.js - Quick Guide
- DC.js - Useful Resources
- DC.js - Discussion
DC.js - Bubble Chart
A bubble chart is used to display three dimensions of the data. It is a variation of scatter chart, in which the data points are replaced with bubbles. The bubble sizes are represented with respect to the data dimension. It uses horizontal and vertical axes as value axes. This chapter explains about bubble chart in detail.
Bubble Chart Methods
Before moving on to draw a bubble chart, we should understand the dc.bubbleChart class and its methods. The dc.bubbleChart uses mixins to get the basic functionality of drawing a chart, which are listed below −
- dc.bubbleMixin
- dc.coordinateGridMixin
The complete class diagram of the dc.bubbleChart is as follows −
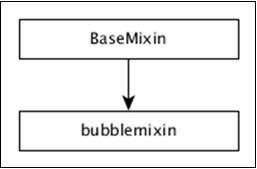
The dc.bubbleChart gets all the methods of the above-specified mixins. It also has its own methods to draw the bubble chart, which are explained below −
elasticRadius( [radius])
This method is used to enable the bubble radius. If we disable this, then the bubble radius will be rescaled automatically.
sortBubbleSize( [sortBubbleSize])
This method is used to enable the sorting feature in bubbles. Smaller bubbles will come first and then they gradually increase.
Draw a Bubble Chart
Let us draw a bubble chart in DC. To do this, we need to follow the steps given below −
Step 1: Define a variable
Let us define a variable as shown below −
var chart = dc.bubbleChart('#bubble');
Here, the bubbleChart function is mapped with the id bubble.
Step 2: Read the data
Read data from the howell1.csv file.
d3.csv("data/howell1.csv", function(errors, people) {
   var mycrossfilter = crossfilter(people);
}
If data is not present, then it returns an error. Now, assign the data to a crossfilter. Here, we have already downloaded the howell1.csv file. The same file will be used here and it will look similar to the following code block.
"height","weight","age","male"
151.765,47.8256065,63,1
139.7,36.4858065,63,0
136.525,31.864838,65,0
156.845,53.0419145,41,1
145.415,41.276872,51,0
163.83,62.992589,35,1
149.225,38.2434755,32,0
168.91,55.4799715,27,1
147.955,34.869885,19,0
165.1,54.487739,54,1
154.305,49.89512,47,0

....................
.....................
Step 3: Fetch the records
Let us fetch the records using the coding given below −
people.forEach(function(x) {
   if(x.male == 1) {
      x.gender = "Male";
   } else {
      x.gender = "Female";
   }
   x.heightRange = (((Math.floor(x.height / 10)) + 1) * 10);
   x.weightRange = (((Math.floor(x.weight / 10)) + 1) * 10);
});
Here, we have checked the gender and have set the x-axis height and width range using the above formula.
Step 4: Set the dimension
We can set the dimension using the coding given below −
var genderDimension = mycrossfilter.dimension(function(data) {
   return [ data.gender, data.heightRange, data.weightRange ];
});
After the dimension has been assigned, group the gender using the coding given below −
var genderGroup = genderDimension.group().reduceCount();
Step 5: Generate the chart
Now, generate a bubble chart using the coding given below −
chart.width(1200)
   .height(400)
   .margins({top: 10, right: 50, bottom: 30, left: 60})
   .dimension(genderDimension)
   .group(genderGroup)
   .keyAccessor(function (p) {
      return p.key[1];
   })

   .valueAccessor(function (p) {
      return p.key[2];
   })

   .radiusValueAccessor(function (p) {
      return (Math.floor((p.value / 10)) + 1);
   })
Here,
We have assigned the chart width as 1200 and the height as 400.
Next, we have specified the margin points.
Then we have assigned the gender dimension and group.
Key and value accessor returns the key and value from the bubbles.
Calculate the radius value accessor function using the formula – Math.floor((p.value / 10)) + 1.
Step 6: Draw bubbles
Now, draw the bubbles using the coding given below −
.x(d3.scale.linear().domain([0, 240]))
.y(d3.scale.linear().domain([-40, 120]))
.r(d3.scale.linear().domain([0, 20]))
.minRadiusWithLabel(1000)
.yAxisPadding(100)
.xAxisPadding(200)
.maxBubbleRelativeSize(0.07)
.renderHorizontalGridLines(true)
.renderVerticalGridLines(true)
.renderLabel(true)
.renderTitle(true)
.title(function (p) {
   return p.key[0]
   + "\n"
   + "Height: " + p.key[1] + " cm\n"
   + "Weight: " + p.key[2] + " kg\n"
   + "Count: " + p.value;
});
Here,
The d3.scale.linear function is used to construct a new linear scale with the specified domain range [0,240] for the x-axis.
Similarly, we assigned y and radius linear scale values.
We specified the minimum radius label value as 1000, x-axis and y-axis padding values as 200 and 100 respectively.
Next, we have specified a maximum bubble relative size value as 0.7.
Render the horizontal and vertical grid lines, then map with the title for bubble key and values.
Step 7: Set TickFormat
Set the ticket formats for x and y-axis using the coding given below −
chart.yAxis().tickFormat(function (s) {
   return s + " cm";
});

chart.xAxis().tickFormat(function (s) {
   return s + " kg";
});
Finally, render the chart using the chart.render() method.
Step 8: Working example
The complete code listing is as shown in the following code block. Create a web page bubble.html and add the following changes to it.
<html>
   <head>
      <title>Bubble chart Sample</title>
      <link rel = "stylesheet" type = "text/css" href = "css/bootstrap.css">
      <link rel = "stylesheet" type = "text/css" href = "css/dc.css"/>

      <script src = "js/d3.js"></script>
      <script src = "js/crossfilter.js"></script>
      <script src = "js/dc.js"></script>
   </head>

   <body>
      <div>
         <div id = "bubble"></div>
      </div>

      <script language = "javascript">
         var chart = dc.bubbleChart('#bubble');

         d3.csv("data/howell1.csv", function(errors, people) {
            var mycrossfilter = crossfilter(people);

            people.forEach(function(x) {
               if(x.male == 1) {
                  x.gender = "Male";
               } else {
                  x.gender = "Female";
               }
               x.heightRange = (((Math.floor(x.height / 10)) + 1) * 10);
               x.weightRange = (((Math.floor(x.weight / 10)) + 1) * 10);
            });

            var genderDimension = mycrossfilter.dimension(function(data) {
               return [ data.gender, data.heightRange, data.weightRange ];
            });
            var genderGroup = genderDimension.group().reduceCount();

            chart.width(1200)
               .height(400)
               .margins({top: 10, right: 50, bottom: 30, left: 60})
               .dimension(genderDimension)
               .group(genderGroup)
               .keyAccessor(function (p) {
                  return p.key[1];
               })

               .valueAccessor(function (p) {
                  return p.key[2];
               })

               .radiusValueAccessor(function (p) {
                  return (Math.floor((p.value / 10)) + 1);
               })

               .x(d3.scale.linear().domain([0, 240]))
               .y(d3.scale.linear().domain([-40, 120]))
               .r(d3.scale.linear().domain([0, 20]))
               .minRadiusWithLabel(1000)
               .yAxisPadding(100)
               .xAxisPadding(200)
               .maxBubbleRelativeSize(0.07)
               .renderHorizontalGridLines(true)
               .renderVerticalGridLines(true)
               .renderLabel(true)
               .renderTitle(true)
               .title(function (p) {
                  return p.key[0]
                  + "\n"
                  + "Height: " + p.key[1] + " cm\n"
                  + "Weight: " + p.key[2] + " kg\n"
                  + "Count: " + p.value;
               });

            chart.yAxis().tickFormat(function (s) {
               return s + " cm";
            });

            chart.xAxis().tickFormat(function (s) {
               return s + " kg";
            });

            chart.render();
         });
      </script>
   </body>
</html>
Now, request the browser and we will see the following response.
To Continue Learning Please Login