- DC.js Tutorial
- DC.js - Home
- DC.js - Introduction
- DC.js - Installation
- DC.js - Concepts
- Introduction to Crossfilter
- Introduction to D3.js
- DC.js - Mixins
- DC.js - baseMixin
- DC.js - capMixin
- DC.js - colorMixin
- DC.js - marginMixin
- DC.js - coordinateGridMixin
- DC.js - Pie Chart
- DC.js - Line Chart
- DC.js - Bar Chart
- DC.js - Composite Chart
- DC.js - Series Chart
- DC.js - Scatter Plot
- DC.js - Bubble Chart
- DC.js - Heat Map
- DC.js - Data Count
- DC.js - Data Table
- DC.js - Data Grid
- DC.js - Legend
- DC.js - Dashboard Working Example
- DC.js Useful Resources
- DC.js - Quick Guide
- DC.js - Useful Resources
- DC.js - Discussion
DC.js - Series Chart
A series is a set of data. You can plot a chart based on the data. This chapter explains how to draw a series chart in detail.
Series Chart Methods
Before moving on to draw a series chart, we should understand the dc.seriesChart class and its methods. The dc.seriesChart uses Mixins to get the basic functionality of drawing a chart. The mixin used by the dc.seriesChart is −
- dc.stackMixin
The complete class diagram of the dc.seriesChart is as follows −
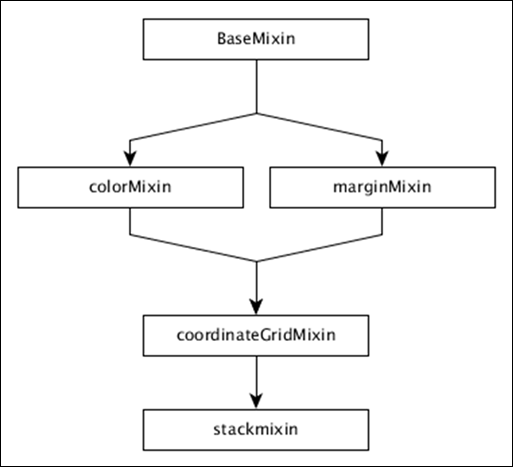
The dc.seriesChart gets all the methods of the above specified mixins. It has its own methods to draw the series chart, which are explained below −
chart( [function])
This method is used to get or set the chart function.
seriesAccessor( [accessor])
It is used to get or set the accessor function for the displayed series.
seriesSort( [sortFunction])
This method is used to get or set a function to sort the list of series by giving series values.
valueSort( [sortFunction])
This method is used to get or set a function to sort the values of each series.
Draw a Series Chart
Let us draw a series chart in DC. In this example, let us take a dataset named as people_hw.csv. The sample data file is as follows −
id,name,gender,height,weight
1,Kinsley,Male,168,90
2,Dimitry,Male,177,61
3,Martica,Female,152,76
4,Brittni,Female,156,88
5,Phillip,Male,161,78
6,Sofie,Female,161,71
7,Avril,Female,163,55
8,Allistir,Male,161,75
9,Emelda,Female,154,66
10,Camella,Female,153,52

...............
...............
The above sample file contains many records. You can download the file by clicking the following link and save it to your DC location.
Now, let us adhere to the following steps to draw a series chart in DC.
Step 1: Define a variable
Let us define the variable as shown below −
var chart = dc.seriesChart('#line');
Here, the seriesChart function is mapped with the id line.
Step 2: Read the data
Read data from the people_hw.csv file −
d3.csv("data/people_hw.csv", function(errors, people) {
   var mycrossfilter = crossfilter(people);
}
If data is not present, then it returns an error. Now, assign the data to a crossfilter. Once we get the data, we can retrieve it one by one and check the gender using the coding given below −
people.forEach(function(x) {
   if(x.gender == 'Male') {
      x.newdata = 1;
   } else {
      x.newdata = 2;
   }
});
Step 3: Create an age dimension
Now, create a dimension for age as shown below −
var hwDimension = mycrossfilter.dimension(function(data) {
   return [data.gender, data.height];
});
Here, we have assigned the dimension and it returns the gender and the height. Now, group it using the reduceCount() function, which is defined below −
var hwGroup = hwDimension.group().reduceCount();
Step 4: Generate a chart
Now, generate a series chart using the coding given below −
chart
   .width(800)
   .height(600)
   .chart(function(c) {
      return dc.lineChart(c).interpolate('cardinal').evadeDomainFilter(true);
   })

   .x(d3.scale.linear().domain([145,180]))
   .elasticY(true)
   .brushOn(false)
   .xAxisLabel("Height")
   .yAxisLabel("Count")
   .dimension(hwDimension)
   .group(hwGroup)
   .seriesAccessor(function(d) { return d.key[0];})
   .keyAccessor(function(d) { return +d.key[1]; })
   .valueAccessor(function(d) { return +d.value; })
   legend(dc.legend().x(350).y(500).itemHeight(13).gap(5).horizontal(1).legendWidth(120)\
      .itemWidth(60));

chart.render();
Here,
- Chart width is 800 and height is 600.
- Using the method d3.scale.linear(), we specify the domain value.
- Using the seriesAccessor function, it displays the series for the datum.
- Key and value accessor returns the key and value from the series.
- Legend can be used to add height and width.
Step 5: Working example
The complete code listing is as follows. Create a web page line_series.html and add the following changes in it.
<html>
   <head>
      <title>Series chart Sample</title>
      <link rel = "stylesheet" type = "text/css" href = "css/bootstrap.css">
      <link rel = "stylesheet" type = "text/css" href = "css/dc.css"/>

      <script src = "js/d3.js"></script>
      <script src = "js/crossfilter.js"></script>
      <script src = "js/dc.js"></script>
   </head>

   <body>
      <div>
         <div id = "line"></div>
      </div>

      <script language = "javascript">
         var chart = dc.seriesChart('#line');

         d3.csv("data/people_hw.csv", function(errors, people) {
            var mycrossfilter = crossfilter(people);

            people.forEach(function(x) {
               if(x.gender == 'Male') {
                  x.newdata = 1;
               } else {
                  x.newdata = 2;
               }
            });

            var hwDimension = mycrossfilter.dimension(function(data) {
               return [data.gender, data.height];
            });
            var hwGroup = hwDimension.group().reduceCount();

            chart
               .width(800)
               .height(600)
               .chart(function(c) {
                  return dc.lineChart(c).interpolate('cardinal').evadeDomainFilter(true);
               })
               .x(d3.scale.linear().domain([145,180]))
               .elasticY(true)
               .brushOn(false)
               .xAxisLabel("Height")
               .yAxisLabel("Count")
               .dimension(hwDimension)
               .group(hwGroup)
               .seriesAccessor(function(d) { return d.key[0];})
               .keyAccessor(function(d) { return +d.key[1]; })
               .valueAccessor(function(d) { return +d.value; })
               .legend(dc.legend().x(350).y(500).itemHeight(13).gap(5).horizontal(1)
                  .legendWidth(120).itemWidth(60));

            chart.render();
         });
      </script>
   </body>
</html>
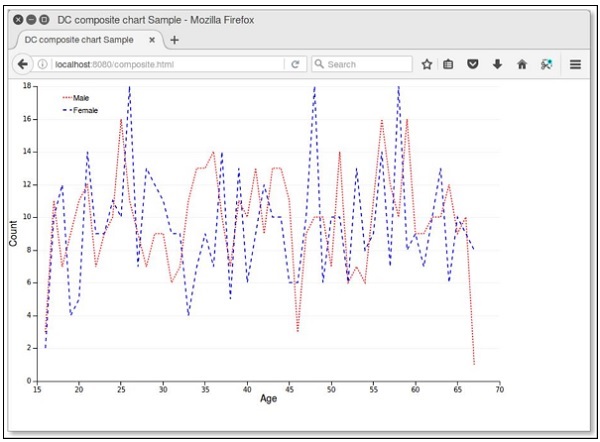
Now, request the browser and we will see the following response.