- DC.js Tutorial
- DC.js - Home
- DC.js - Introduction
- DC.js - Installation
- DC.js - Concepts
- Introduction to Crossfilter
- Introduction to D3.js
- DC.js - Mixins
- DC.js - baseMixin
- DC.js - capMixin
- DC.js - colorMixin
- DC.js - marginMixin
- DC.js - coordinateGridMixin
- DC.js - Pie Chart
- DC.js - Line Chart
- DC.js - Bar Chart
- DC.js - Composite Chart
- DC.js - Series Chart
- DC.js - Scatter Plot
- DC.js - Bubble Chart
- DC.js - Heat Map
- DC.js - Data Count
- DC.js - Data Table
- DC.js - Data Grid
- DC.js - Legend
- DC.js - Dashboard Working Example
- DC.js Useful Resources
- DC.js - Quick Guide
- DC.js - Useful Resources
- DC.js - Discussion
DC.js - coordinateGridMixin
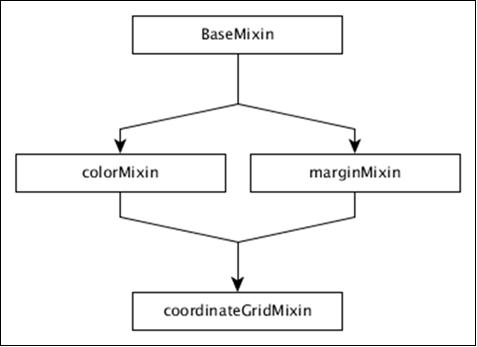
The Coordinate & Axis also termed as coordinateGridMixin is designed to support a number of coordinate grid based concrete chart types such as Bar Chart, Line Chart, etc. The hierarchy of coordinateGridMixin is defined in the diagram below.
The coordinateGridMixin supports a number of methods to reduce the workload in creating the coordinate axis and they are as follows −
- brushOn( [brushOn])
- chartBodyG( [body])
- clipPadding( [pad])
- elasticX( [X])
- focus( [range])
- g( [root])
- isOrdinal()
- mouseZoomable( [Zoom])
- rangeChart( [range])
- round(r)
- xAxisMax()
- xAxisMin()
- xUnitCount()
Let us discuss each of these methods in brief.
brushOn( [brushOn])
It is a brush-based range filter. You can set it On/Off. If brushing is on, the user can drag the mouse across a chart. Turning on can disable other interactive elements on the chart such as highlighting, tool tips and reference lines. It is defined below −
chart.brushOn = function (brushOn) {
   if (!arguments.length) {
      return _brushOn;
   }
   _brushOn = brushOn;
   return chart;
};
chartBodyG( [body])
It is used to retrieve the SVG group for the chart body. You can call this function as shown below −
chart.chartBodyG = function (body) {
   if (!arguments.length) {
      return _chartBodyG;
   }
};
clipPadding( [pad])
It is used to get or set the padding in pixels for the clip path. It is defined below −
chart.clipPadding = function (pad) {
   if (!arguments.length) {
      return _clipPadding;
   }
};
elasticX( [X])
This method is used to turn on/off elastic x-axis behavior. If the x-axis elasticity is turned on, then the grid chart will attempt to recalculate the x-axis range. It triggers a redraw event that is defined below −
chart.elasticX = function (X) {
   if (!arguments.length) {
      return _x;
   }
}
Similarly, you can perform elasticY( [Y]).
focus( [range])
This method is used to zoom the chart to focus on the given range. The given range should be an array containing only two elements ([start, end]).
g( [root])
This method is used to get or set the root g element.
isOrdinal()
This method is used to return the chart ordinal xUnits. Most charts behave differently with ordinal data and use the result of this method to trigger the appropriate logic.
mouseZoomable( [Zoom])
This method is used to set or get mouse zoom capability.
rangeChart( [range])
It is used to get or set the range selection chart associated with the instance.
round(r)
This method is used to set or get the rounding function used to quantize the selection when brushing is enabled.
xAxisMax()
Calculates the maximum x value to display in the chart. Similarly, we can perform for Y-axis.
xAxisMin()
Calculates the minimum x value to display in the chart. Similarly, we can perform for Y-axis.
xUnitCount()
Returns the number of units displayed on the x-axis. Similarly, we can perform for Y-axis.