- DC.js Tutorial
- DC.js - Home
- DC.js - Introduction
- DC.js - Installation
- DC.js - Concepts
- Introduction to Crossfilter
- Introduction to D3.js
- DC.js - Mixins
- DC.js - baseMixin
- DC.js - capMixin
- DC.js - colorMixin
- DC.js - marginMixin
- DC.js - coordinateGridMixin
- DC.js - Pie Chart
- DC.js - Line Chart
- DC.js - Bar Chart
- DC.js - Composite Chart
- DC.js - Series Chart
- DC.js - Scatter Plot
- DC.js - Bubble Chart
- DC.js - Heat Map
- DC.js - Data Count
- DC.js - Data Table
- DC.js - Data Grid
- DC.js - Legend
- DC.js - Dashboard Working Example
- DC.js Useful Resources
- DC.js - Quick Guide
- DC.js - Useful Resources
- DC.js - Discussion
DC.js - Bar Chart
Bar chart is one of the most commonly used types of graph and are used to display and compare the number, frequency or other measure (e.g. mean) for different discrete categories or groups. The graph is constructed such that the heights or lengths of the different bars are proportional to the size of the category they represent.
The x-axis (the horizontal axis) represents the different categories it has no scale. The y axis (the vertical axis) does have a scale and this indicates the units of measurement. The bars can be drawn either vertically or horizontally depending upon the number of categories and length or complexity of the category.
Bar Chart Methods
Before moving to draw a bar chart, we should understand the dc.barChart class and its methods. The dc.barChart uses mixins to get the basic functionality of drawing a chart. The mixins used by the dc.barChart are as follows −
- dc.stackMixin
- dc.coordinateGridMixin
The complete class diagram of the dc.barChart is as follows −
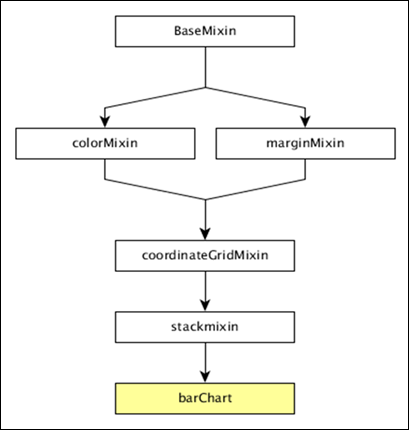
The dc.barChart gets all the methods of the above specified mixins. In addition, it also has its own methods to draw the bar chart. They are explained as follows −
alwaysUseRounding( [round])
This method is used to get or set whether rounding is enabled when the bars are centered.
barPadding( [pad])
This method is used to get or set the spacing between bars as a fraction of bar size. The possible padding values are between 0-1.
centerBar( [centerBar])
This method is used to set the bar, centered around the data position on the x-axis.
gap( [gap])
This method is used to set a fixed gap between the bars.
outerPadding( [pad])
This method is used to set the outer padding on an ordinal bar chart.
Draw a Bar Chart
Let us draw a bar chart in DC. To do this, we should follow the steps given below −
Step 1: Define a variable
Let us define a chart variable as shown below −
var chart = dc.barChart('#bar');
Here, the dc.barChart function is mapped with a container having bar as the id.
Step 2: Read the data
Read data from the people.csv file.
d3.csv("data/people.csv", function(errors, people) {
   var mycrossfilter = crossfilter(people);
}
If the data is not present, then it returns an error. Now, assign the data to Crossfilter. For this example, we will use the same people.csv file, which looks as follows −
id,name,gender,DOB,MaritalStatus,CreditCardType
1,Damaris,Female,1973-02-18,false,visa-electron
2,Barbe,Female,1969-04-10,true,americanexpress
3,Belia,Female,1960-04-16,false,maestro
4,Leoline,Female,1995-01-19,true,bankcard
5,Valentine,Female,1992-04-16,false,
6,Rosanne,Female,1985-01-05,true,bankcard
7,Shalna,Female,1956-11-01,false,jcb
8,Mordy,Male,1990-03-27,true,china-unionpay
..................
..................
..................
Step 3: Create an age dimension
Now, create a dimension for age as shown below −
var ageDimension = mycrossfilter.dimension(function(data) {
   return ~~((Date.now() - new Date(data.DOB)) / (31557600000))
});
Here, we assigned the age from the Crossfilter data. The ~~ is a double NOT bitwise operator. It is used as a faster substitute for the Math.floor() function.
Now, group it using the reduceCount() function that is shown below −
var ageGroup = ageDimension.group().reduceCount();
Step 4: Generate a chart
Now, generate a bar chart using the coding given below −
chart
   .width(800)
   .height(300)
   .x(d3.scale.linear().domain([15,70]))
   .brushOn(false)
   .yAxisLabel("Count")
   .xAxisLabel("Age")
   .dimension(ageDimension)
   .group(ageGroup)
   .on('renderlet', function(chart) {
      chart.selectAll('rect').on('click', function(d) {
         console.log('click!', d);
      });
   });

chart.render();
Here,
Chart width is 800 and height is 300.
The d3.scale.linear function is used to construct a new linear scale with the specified domain range [15, 70].
Next, we set the brushOn value to false.
We assign the y-axis label as count and x-axis label as age.
Finally, group the age using the ageGroup function.
Step 5: Working example
The complete code listing is as follows. Create a web page bar.html and add the following changes to it.
<html>
   <head>
      <title>DC Bar chart Sample</title>
      <link rel = "stylesheet" type = "text/css" href = "css/bootstrap.min.css">
      <link rel = "stylesheet" type = "text/css" href = "css/dc.css"/>

      <script src = "js/d3.js"></script>
      <script src = "js/crossfilter.js"></script>
      <script src = "js/dc.js"></script>
   </head>

   <body>
      <div>
         <div id = "bar"></div>
      </div>

      <script language = "javascript">
         var chart = dc.barChart('#bar');

         d3.csv("data/people.csv", function(errors, people) {
            var mycrossfilter = crossfilter(people);

            var ageDimension = mycrossfilter.dimension(function(data) {
               return ~~((Date.now() - new Date(data.DOB)) / (31557600000))
            });
            var ageGroup = ageDimension.group().reduceCount();

            chart
               .width(800)
               .height(300)
               .x(d3.scale.linear().domain([15,70]))
               .brushOn(false)
               .yAxisLabel("Count")
               .xAxisLabel("Age")
               .dimension(ageDimension)
               .group(ageGroup)
               .on('renderlet', function(chart) {
                  chart.selectAll('rect').on('click', function(d) {
                     console.log('click!', d);
                  });
               });
            chart.render();
         });
      </script>
   </body>
</html>
Now, request the browser and we will see the following response.