- DC.js Tutorial
- DC.js - Home
- DC.js - Introduction
- DC.js - Installation
- DC.js - Concepts
- Introduction to Crossfilter
- Introduction to D3.js
- DC.js - Mixins
- DC.js - baseMixin
- DC.js - capMixin
- DC.js - colorMixin
- DC.js - marginMixin
- DC.js - coordinateGridMixin
- DC.js - Pie Chart
- DC.js - Line Chart
- DC.js - Bar Chart
- DC.js - Composite Chart
- DC.js - Series Chart
- DC.js - Scatter Plot
- DC.js - Bubble Chart
- DC.js - Heat Map
- DC.js - Data Count
- DC.js - Data Table
- DC.js - Data Grid
- DC.js - Legend
- DC.js - Dashboard Working Example
- DC.js Useful Resources
- DC.js - Quick Guide
- DC.js - Useful Resources
- DC.js - Discussion
DC.js - colorMixin
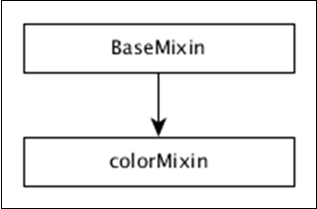
colorMixin provides the color support for all the charts, which need to visualize using colors. The hierarchy of the colorMixin is defined in the diagram below.
colorMixin provides the following list of methods to work with colors and they are as follows −
colorAccessor( [colorAccessor])
Gets or sets the color accessor function. This will map a distinct color value in the color scale for each data point in the underlying Crossfilter group. The default color accessor is as follows −
mychart.colorAccessor(function (d, i){return i;})
colorDomain( [domain])
Gets or sets the current domain for the color mapping function and it must be supplied as an array.
calculateColorDomain()
Sets the color domain by determining the min and max values of the data element found using the colorAccessor() function.
colors( [colorScale])
Gets or sets a color scale. It accepts the d3.scale.
chart.colors(d3.scale.category20b());
chart.colors(d3.scale.ordinal().range(['red','green','blue']));
linearColors(r)
A shortcut method to set interpolated linear color scale.
chart.linearColors(["#4575b4", "#ffffbf", "#a50026"]);
ordinalColors(r)
A shortcut method to set the ordinal color scale.
chart.ordinalColors(['red','green','blue']);