- SAP Web Dynpro - Home
- SAP Web Dynpro - Overview
- Configuration & Integration
- Architecture
- Navigation
- Component
- Mapping & Data Binding
- Event & Actions
- Application
- URL of an Application
- Creating an Application
- Component Interfaces
- Faceless Components
- Assistance Class
- Service Call In an Application
- Using a Service Call
- Debugging an Application
- Version Management
- Messages
- Integration Messages
- Personalization & Configuration
- Portal Integration
- Integrate WDA in Portal
- Interactive Forms
- SAP List Viewer(ALV)
- Administration
- Monitoring an Application
- Web Dynpro - Questions Answers
- SAP Web Dynpro - Quick Guide
- SAP Web Dynpro - Useful Resources
- SAP Web Dynpro - Discussion
Selected Reading
SAP Web Dynpro - Monitoring an Application
You can monitor Web Dynpro application using ABAP monitor. Information is stored about Web Dynpro application. You can view this information using T-code − RZ20.
You can check the following information in Web Dynpro ABAP monitor −
- Session Count
- Application Count
- CPU time
- Data
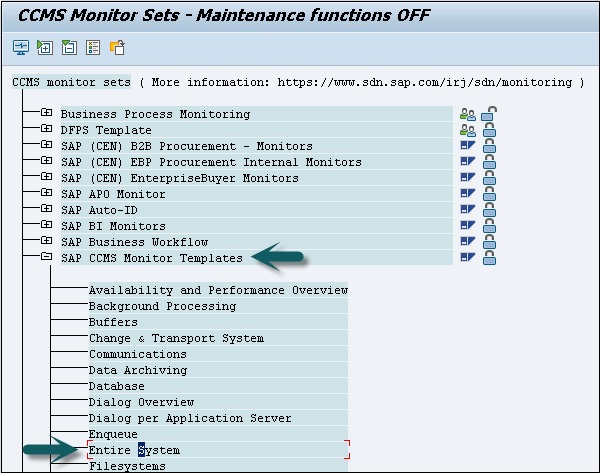
To view the report, use T-code − RZ20
Step 1 − Go to SAP CCMS Monitor template.
Step 2 − Click the sub node Entire System.
Step 3 − Enter the system ID of the current SAP system where the application you want to monitor is installed.
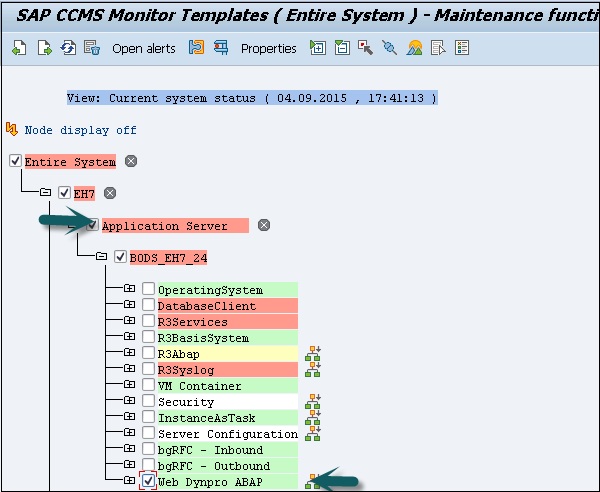
Step 4 − Select Application Server.
Step 5 − Select the name of the relevant application server. For instance, select Web Dynpro ABAP as shown in the following screenshot −
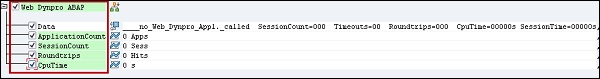
The result will be displayed with the following information when a Web Dynpro application will be called −
- Data
- Application Count
- Session Count
- Round trips
- CPU Time

Advertisements