- SAP Web Dynpro - Home
- SAP Web Dynpro - Overview
- Configuration & Integration
- Architecture
- Navigation
- Component
- Mapping & Data Binding
- Event & Actions
- Application
- URL of an Application
- Creating an Application
- Component Interfaces
- Faceless Components
- Assistance Class
- Service Call In an Application
- Using a Service Call
- Debugging an Application
- Version Management
- Messages
- Integration Messages
- Personalization & Configuration
- Portal Integration
- Integrate WDA in Portal
- Interactive Forms
- SAP List Viewer(ALV)
- Administration
- Monitoring an Application
- Web Dynpro - Questions Answers
- SAP Web Dynpro - Quick Guide
- SAP Web Dynpro - Useful Resources
- SAP Web Dynpro - Discussion
SAP Web Dynpro - Debugging an Application
There are various tools in ABAP workbench that you can use for debugging purpose of source code. You can test all source code of Web Dynpro application using a debugger.
Step 1 − To start the debugger, you have to select a new debugger in ABAP workbench.
Step 2 − Go to Utilities → Settings
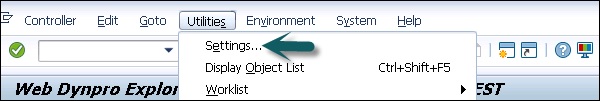
A dialog box now appears that contains two nested tab page areas.
Step 3 − Choose the parent tab page ABAP Editor.
The settings for ABAP Editor always open with the content of the child tab page Editor.
Step 4 − Select the Front End Editor (New).
Step 5 − Now switch to the Debugging tab page in the ABAP Editor settings and select New Debugger.
Step 6 − Save your changes and close the dialog.
How to Start the Debugging Process?
If you want to run an application in debugging mode, you need to set an external breakpoint in one of the methods in Dynpro component.
It is suggested to set the breakpoint in method WDDOMODIFYVIEW under METHODS tab of Dynpro view. Provided that the context of the view controller is not filled using a supply method, the view is fully instantiated in the phase model at this point in time.
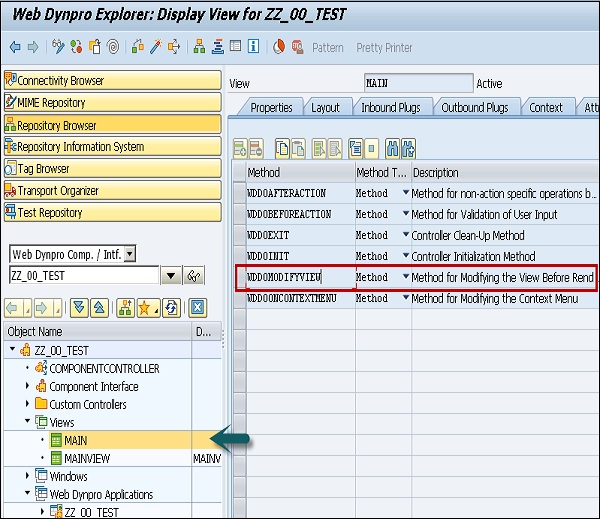
Note − The method in which you set the breakpoint depends on the purpose of the test run and it is advised to set it in WDDMODIFYVIEW.
When you start a Web Dynpro application, a debugger automatically starts in another session.
