- SAP Web Dynpro - Home
- SAP Web Dynpro - Overview
- Configuration & Integration
- Architecture
- Navigation
- Component
- Mapping & Data Binding
- Event & Actions
- Application
- URL of an Application
- Creating an Application
- Component Interfaces
- Faceless Components
- Assistance Class
- Service Call In an Application
- Using a Service Call
- Debugging an Application
- Version Management
- Messages
- Integration Messages
- Personalization & Configuration
- Portal Integration
- Integrate WDA in Portal
- Interactive Forms
- SAP List Viewer(ALV)
- Administration
- Monitoring an Application
- Web Dynpro - Questions Answers
- SAP Web Dynpro - Quick Guide
- SAP Web Dynpro - Useful Resources
- SAP Web Dynpro - Discussion
SAP Web Dynpro - Administration
In Web Dynpro ABAP administration, you can perform various administration tasks using different tools −
- ICM Tracing
- Web Dynpro Trace tool
- Browser Tracing
- Logging
- Security
Trace Tool
Web Dynpro trace tool can be used for checking the errors and problems in Dynpro application. You can activate Web Dynpro trace tool for a specific user.
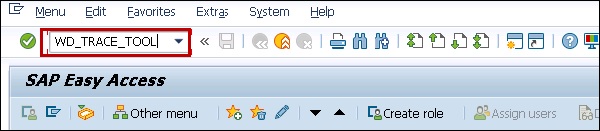
Step 1 − To activate trace tool in SAP GUI client, use T-code − WD_TRACE_TOOL
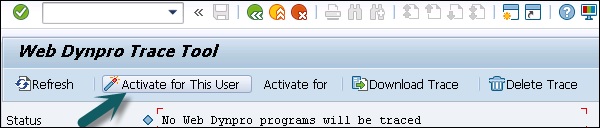
Step 2 − Click on Activate for this user. This allows to set the trace active for the user.
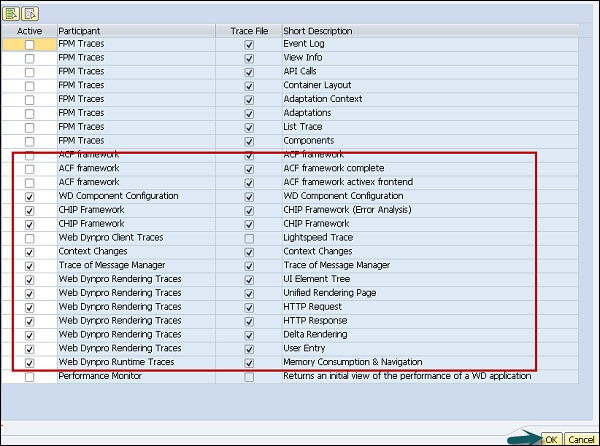
Step 3 − Select Trace features in the new window and click OK.
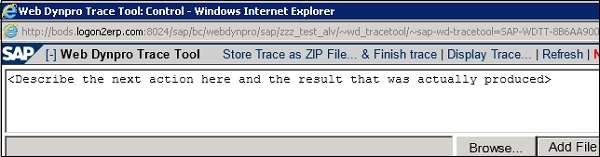
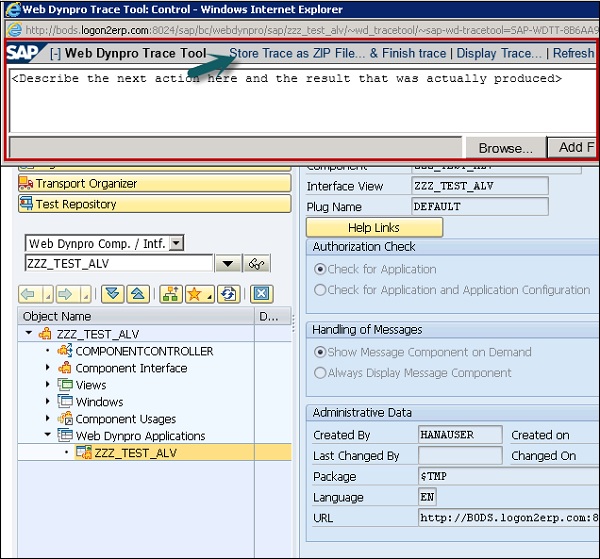
Step 4 − Start Web Dynpro application that you want to trace. You can see a new area Web Dynpro trace tool in Web application.
Step 5 − Execute the application. Enter the details of problem → Choose Continue.
Step 6 − You can also send it with Insert and add a screenshot or you insert a file with additional information. Go to Browse → Select File and click Add File.
Step 7 − You can download the trace file in Zip format and end tracing by clicking on Save Trace as Zip file and Stop Trace.
This file can be uploaded to SAP portal and can be sent to SAP for debugging.
ICM Tracing
To analyze the problem, you can also trace the data stream in SAP Web Application server.
Step 1 − Use T-Code − SMICM. In the next window, click on GOTO → Trace File → Display file or start.
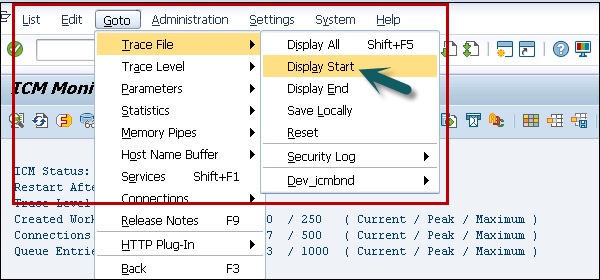
You will see ICM trace result as shown in the following screenshot −
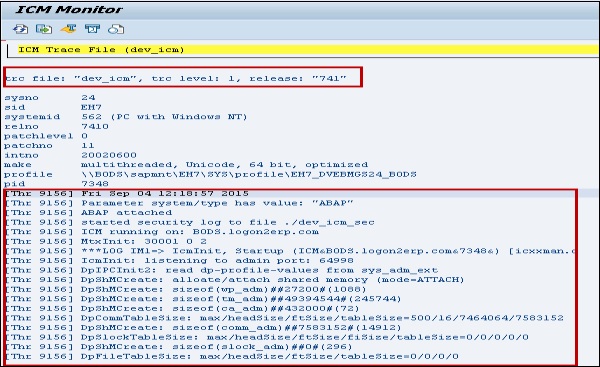
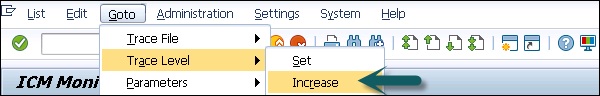
Step 2 − You can also increase the trace level from default level 1. To increase the trace level, GOTO → Trace Level → Increase.
HTTP Browser Tracing
This is used to analyze the dynamic behavior of your code. This can be used as an alternative to ICM tracing.
To use browser tracing, you need to install proxy tool on your local system.
