- SAP BW on HANA - Home
- SAP BW on HANA - Overview
- SAP BW Basics
- SAP HANA Basics
- SAP BW on HANA - Architecture
- SAP BW on HANA - Benefits
- Native HANA Modeling
- BW Data Warehousing
- BW Database Version
- SAP BW on HANA - Modeling Tools
- SAP BW on HANA - Migration
- SAP BW on HANA - Migration Tools
- SAP BW on HANA - Data Mngmt
- HANA Optimized InfoCubes
- Composite Providers
- Composite Providers in HANA
- SAP BW on HANA - Advanced DSOs
- SAP BW on HANA - Hybrid Modeling
- HANA Views for BW InfoProviders
- SAP BW on HANA - HANA Live
- Data Provisioning
- SLT Replication HANA
- SLT Replication BW
- DB Connect
- HANA View for InfoCube
- SAP BW on HANA - Process Chain
- HANA vs BWA
- SAP BW on HANA - Authorization
- Consultant Responsibilities
SAP BW on HANA - Native HANA Modeling
SAP HANA Modeler option is used to create information views on the top of schemas → tables in HANA database. These views are consumed by JAVA/HTML based applications or SAP Applications such as SAP Lumira, Office Analysis, or third party software like MS Excel for reporting purposes to meet business logic and to perform analysis and extract information.
HANA Modeling is done on the top of tables available in Catalog tab under Schema in HANA Studio and all views are saved under the Content table under Package.
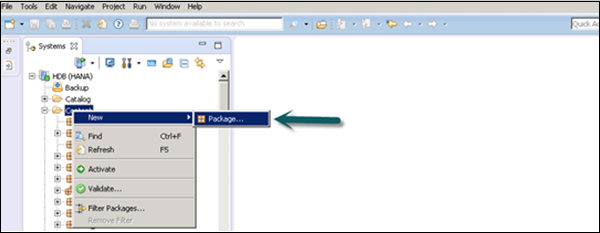
You can create a new Package under the Content tab in HANA Studio using right-click on Content and New.
All Modeling Views created inside one package comes under the same package in HANA Studio and is categorized according to the View Type.
Each View has a different structure for Dimension and Fact tables. Dimension tables are defined with master data. Fact table has a Primary Key for dimension tables and measures like Number of Unit sold, Average delay time, Total Price, etc.
You can create a new Package by a right-click on the Content Tab → New → Package.
You can also create a Sub Package under a Package by a right-click on the Package name. When we right click on the Package, we get 7 options. We can create HANA Views Attribute Views, Analytical Views, and Calculation Views under a Package.
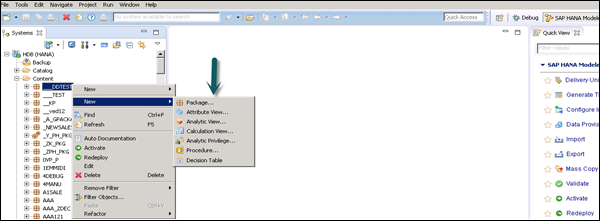
You can also create a Decision Table, define an Analytic Privilege and create Procedures in a Package.
When you right-click on Package and click New, you can also create sub packages in a Package. You have to enter Package Name, Description while creating a Package.
SAP HANA Attribute View
Attribute Views in SAP HANA Modeling are created on the top of Dimension tables. They are used to join Dimension tables or other Attribute Views.
You can also copy a new Attribute View from an already existing Attribute Views inside other Packages but that doesnt let you change the View Attributes.
Following are few characteristics of an Attribute View in SAP HANA −
Attribute Views in HANA are used to join Dimension tables or other Attribute Views.
Attribute Views are used in Analytical and Calculation Views for analysis to pass the master data.
They are similar to characteristics in BM and contain master data.
Attribute Views are used for performance optimization in large size dimension tables. You can limit the number of attributes in an Attribute View, which are further used for Reporting and analysis purpose.
Attribute Views are used to model master data to give some context.
Create an Attribute View
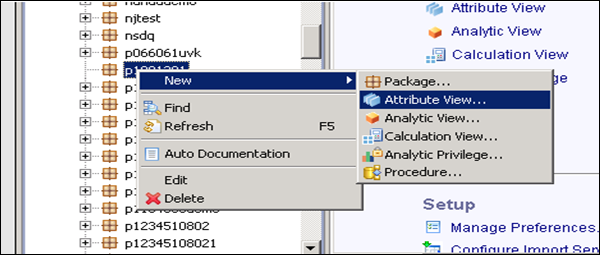
Choose the Package name under which you want to create an Attribute View. Right-click on Package → Go to New → Attribute View.
When you click on Attribute View, a New Window will open. Enter Attribute View name and Description. Then, from the dropdown list, choose View Type and subtype. In subtype, there are 3 types of Attribute views: Standard, Time, and Derived.
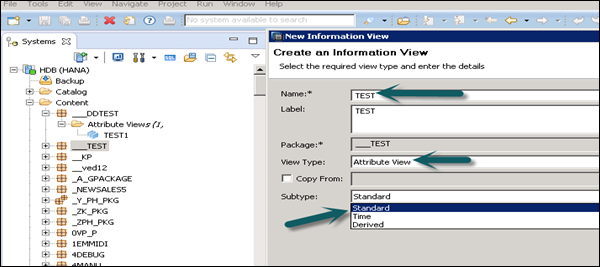
Time subtype Attribute View is a special type of Attribute view that adds a Time Dimension to Data Foundation. When you enter the Attribute name, Type and Subtype and click Finish, it will open three work panes −
Scenario pane that has Data Foundation and Semantic Layer.
Details pane shows the attribute of all tables added to Data Foundation and the joining between them.
Output pane where we can add attributes from the Detail pane to filter in the report.
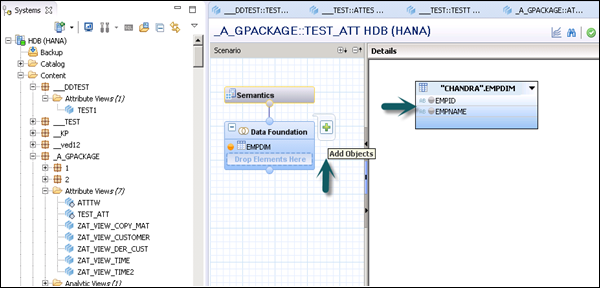
You can add Objects to Data Foundation by clicking the + sign written next to Data Foundation. You can add multiple Dimension tables and Attribute Views in the Scenario Pane and join them using a Primary Key.
When you click on Add Object in Data Foundation, you will get a search bar from where you can add Dimension tables and Attribute views to the Scenario Pane. Once Tables or Attribute Views are added to Data Foundation, they can be joined using a Primary Key in the Details Pane as shown in the following screenshot.
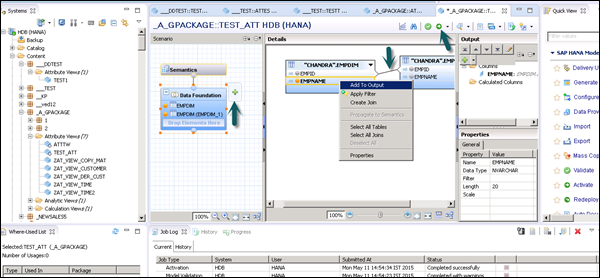
Once the join is complete, choose multiple attributes in the Details pane, right-click and Add to Output.
All columns will be added to the Output pane. Click the Activate option and you will get a confirmation message in the job log.
Now you can right-click on the Attribute View and go for Data Preview.
Note − When a View is not activated, it has a diamond mark on it. However, once you activate it, that diamond disappears which confirms that the View has been activated successfully.
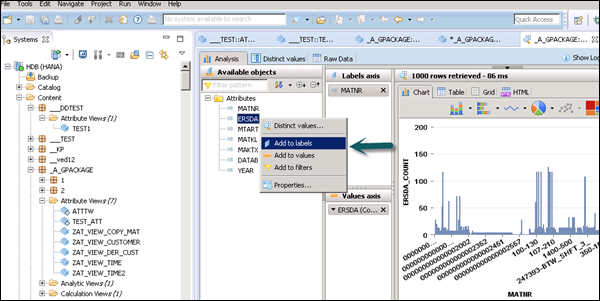
Once you click Data Preview, it will show all the attributes that has been added to the Output pane under Available Objects.
You can right-click and add to Labels and Value axis or simply drag the objects as shown in the following screenshot.
SAP HANA Analytic View
Analytic View is in the form of Star Schema where we join one Fact table to multiple Dimension tables. Analytic views use real power of SAP HANA to perform complex calculations and aggregate functions by joining the tables in the form of Star Schema and by executing Star schema queries. Following are a few properties of SAP HANA Analytic View −
Analytic Views are used to perform complex calculations and Aggregate functions like Sum, Count, Min, Max, etc.
Analytic Views are designed to run Start Schema queries.
Each Analytic View has one Fact table surrounded by multiple dimension tables. Fact table contains a primary key for each Dimension table and measures.
Analytic Views are similar to Info Objects and Info sets of SAP BW.
Create an Analytic View
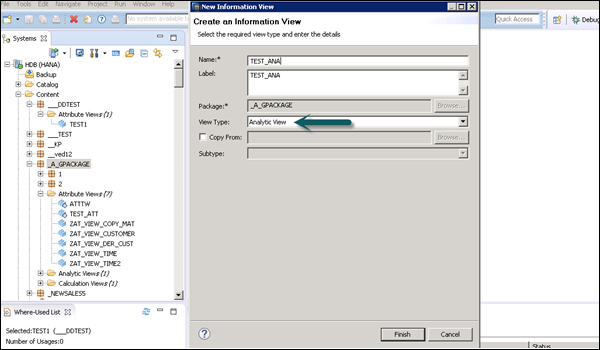
Choose the Package name under which you want to create an Analytic View. Right-click on Package → Go to New → Analytic View. When you click on an Analytic View, a new window will open. Enter the View name and Description. From the dropdown list, choose the View Type and click Finish.
When you click Finish, you can see an Analytic View with Data Foundation and Star Join option.
Click Data Foundation to add Dimension and Fact tables. Click Star Join to add Attribute Views.
Add Dimension and Fact tables to Data Foundation using + sign. In the following example, 3 dimension tables have been added DIM_CUSTOMER, DIM_PRODUCT, DIM_REGION, and 1 Fact table FCT_SALES to the Details Pane. Joining the Dimension table to Fact table using Primary Keys is stored in Fact table.
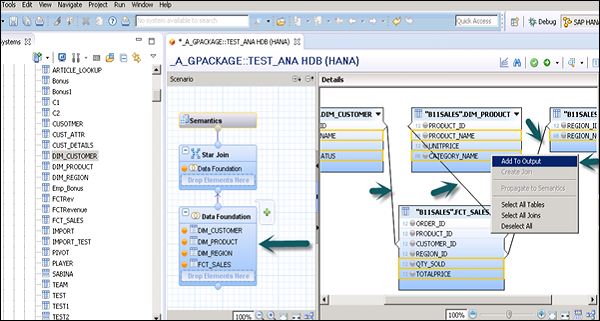
Select Attributes from Dimension and Fact table to add to the Output pane as shown in the above screenshot. Now, change the data type of Facts from the Fact table to measures.
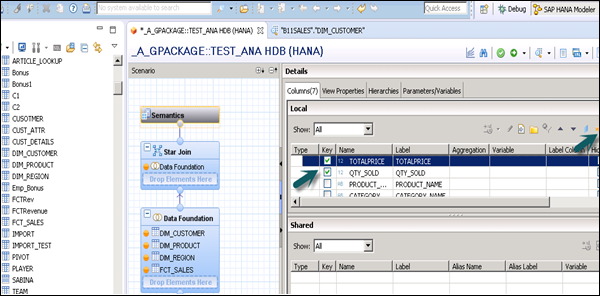
Click the Semantic layer, choose facts and click the measures sign as shown in the following screenshot to change datatype to measures, and activate the view.
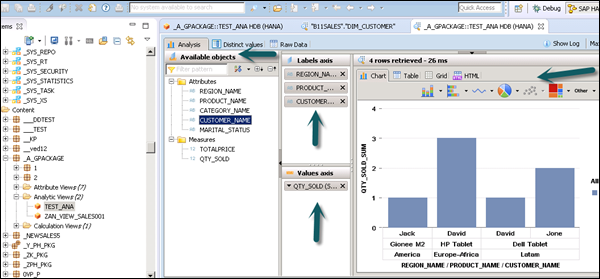
Once you activate the view and click Data Preview, all attributes and measures will be added under the list of available objects. Add attributes to the Labels Axis and measure to the Value Axis for analysis purpose.
There is an option to choose different types of chart and graphs.
SAP HANA Calculation View
Calculation View is used to consume other analytic, attribute, and other calculation views and base column tables. These are used to perform complex calculations which are not possible with other types of Views. Following are a few characteristics of Calculation View −
Calculation View is used to consume Analytic, Attribute, and other Calculation Views.
They are used to perform complex calculations which are not possible with other Views.
There are two ways to create Calculation Views - SQL Editor or Graphical Editor.
Built-in Union, Join, Projection and Aggregation nodes.
Create a Calculation View
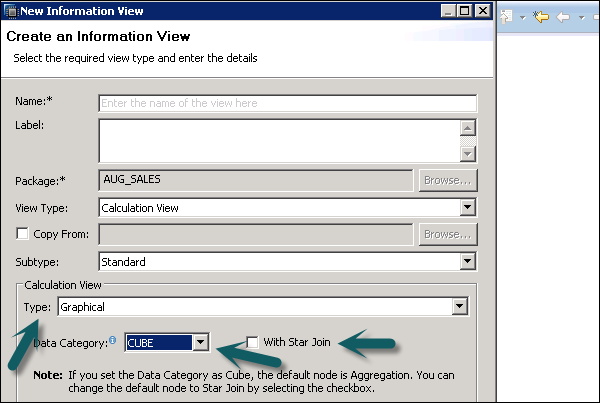
Choose the Package name under which you want to create a Calculation View. Right-click on Package → New → Calculation View. When you click on Calculation View, a new window will open.
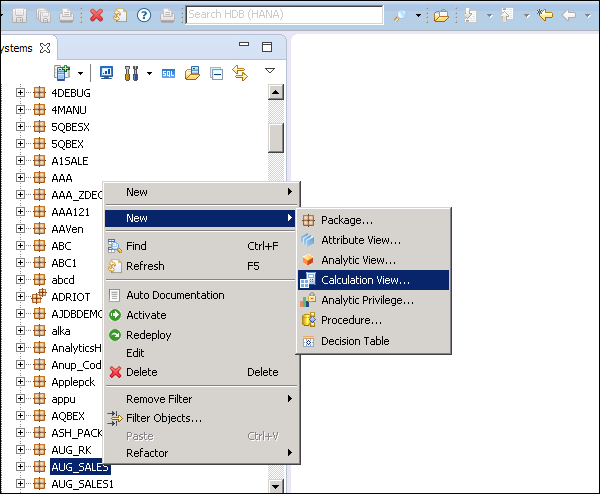
Enter the View name, Description and choose the View type as Calculation View, Subtype Standard or Time (this is special kind of View which adds time dimension). You can use two types of Calculation View: Graphical and SQL Script.
Graphical Calculation Views − It has default nodes like aggregation, Projection, Join and Union. It is used to consume other Attribute, Analytic, and other Calculation views.
SQL Script based Calculation Views − It is written in SQL scripts that are built on SQL commands or HANA defined functions.
Data Category − Cube, in this default node is Aggregation. You can choose Star join with Cube dimension. Dimension, in this default node is Projection.
You can check for more details on native HANA modeling in our SAP HANA Tutorial.
