- Home
- Basics
- Python Ecosystem
- Methods for Machine Learning
- Data Loading for ML Projects
- Understanding Data with Statistics
- Understanding Data with Visualization
- Preparing Data
- Data Feature Selection
- ML Algorithms - Classification
- Introduction
- Logistic Regression
- Support Vector Machine (SVM)
- Decision Tree
- Naïve Bayes
- Random Forest
- ML Algorithms - Regression
- Random Forest
- Linear Regression
- ML Algorithms - Clustering
- Overview
- K-means Algorithm
- Mean Shift Algorithm
- Hierarchical Clustering
- ML Algorithms - KNN Algorithm
- Finding Nearest Neighbors
- Performance Metrics
- Automatic Workflows
- Improving Performance of ML Models
- Improving Performance of ML Model (Contd…)
- ML With Python - Resources
- Machine Learning With Python - Quick Guide
- Machine Learning with Python - Resources
- Machine Learning With Python - Discussion
Machine Learning - Jupyter Notebook
Jupyter notebooks basically provides an interactive computational environment for developing Python based Data Science applications. They are formerly known as ipython notebooks. The following are some of the features of Jupyter notebooks that makes it one of the best components of Python ML ecosystem −
Jupyter notebooks can illustrate the analysis process step by step by arranging the stuff like code, images, text, output etc. in a step by step manner.
It helps a data scientist to document the thought process while developing the analysis process.
One can also capture the result as the part of the notebook.
With the help of jupyter notebooks, we can share our work with a peer also.
Installation and Execution
If you are using Anaconda distribution, then you need not install jupyter notebook separately as it is already installed with it. You just need to go to Anaconda Prompt and type the following command −
C:\>jupyter notebook
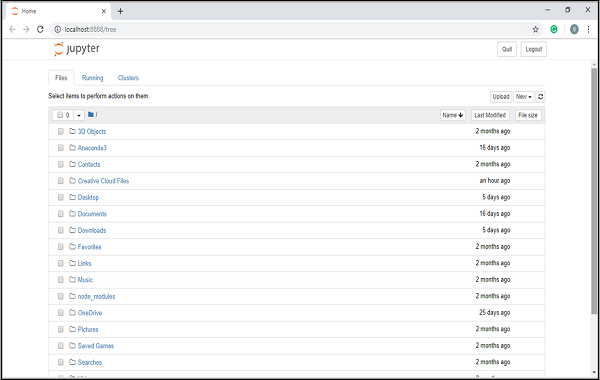
After pressing enter, it will start a notebook server at localhost:8888 of your computer. It is shown in the following screen shot −
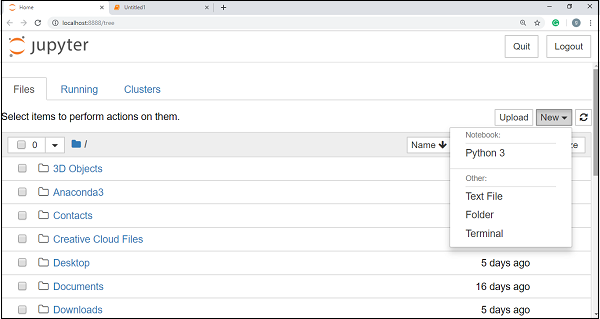
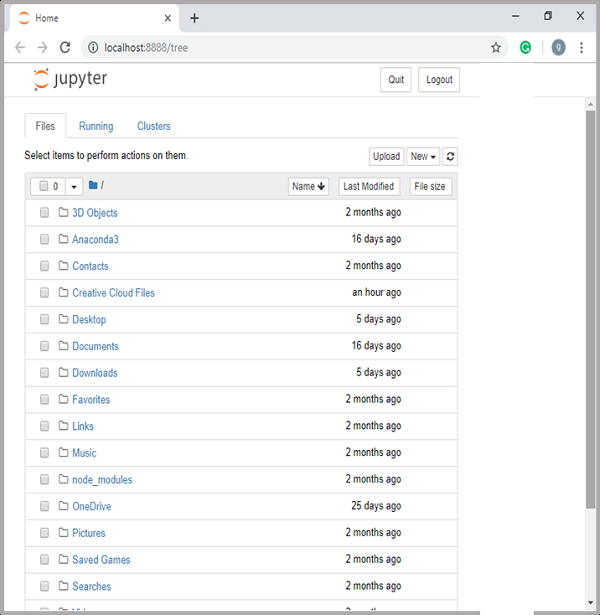
Now, after clicking the New tab, you will get a list of options. Select Python 3 and it will take you to the new notebook for start working in it. You will get a glimpse of it in the following screenshots −
On the other hand, if you are using standard Python distribution then jupyter notebook can be installed using popular python package installer, pip.
pip install jupyter
Types of Cells in Jupyter Notebook
The following are the three types of cells in a jupyter notebook −
Code cells − As the name suggests, we can use these cells to write code. After writing the code/content, it will send it to the kernel that is associated with the notebook.
Markdown cells − We can use these cells for notating the computation process. They can contain the stuff like text, images, Latex equations, HTML tags etc.
Raw cells − The text written in them is displayed as it is. These cells are basically used to add the text that we do not wish to be converted by the automatic conversion mechanism of jupyter notebook.
For more detailed study of jupyter notebook, you can go to the link www.tutorialspoint.com/jupyter/index.htm.
NumPy
It is another useful component that makes Python as one of the favorite languages for Data Science. It basically stands for Numerical Python and consists of multidimensional array objects. By using NumPy, we can perform the following important operations −
- Mathematical and logical operations on arrays.
- Fourier transformation
- Operations associated with linear algebra.
We can also see NumPy as the replacement of MatLab because NumPy is mostly used along with Scipy (Scientific Python) and Mat-plotlib (plotting library).
Installation and Execution
If you are using Anaconda distribution, then no need to install NumPy separately as it is already installed with it. You just need to import the package into your Python script with the help of following −
import numpy as np
On the other hand, if you are using standard Python distribution then NumPy can be installed using popular python package installer, pip.
pip install NumPy
After installing NumPy, you can import it into your Python script as you did above.
For more detailed study of NumPy, you can go to the link www.tutorialspoint.com/numpy/index.htm.
Pandas
It is another useful Python library that makes Python one of the favorite languages for Data Science. Pandas is basically used for data manipulation, wrangling and analysis. It was developed by Wes McKinney in 2008. With the help of Pandas, in data processing we can accomplish the following five steps −
- Load
- Prepare
- Manipulate
- Model
- Analyze
Data representation in Pandas
The entire representation of data in Pandas is done with the help of following three data structures −
Series − It is basically a one-dimensional ndarray with an axis label which means it is like a simple array with homogeneous data. For example, the following series is a collection of integers 1,5,10,15,24,25...
| 1 | 5 | 10 | 15 | 24 | 25 | 28 | 36 | 40 | 89 |
Data frame − It is the most useful data structure and used for almost all kind of data representation and manipulation in pandas. It is basically a two-dimensional data structure which can contain heterogeneous data. Generally, tabular data is represented by using data frames. For example, the following table shows the data of students having their names and roll numbers, age and gender.
| Name | Roll number | Age | Gender |
|---|---|---|---|
| Aarav | 1 | 15 | Male |
| Harshit | 2 | 14 | Male |
| Kanika | 3 | 16 | Female |
| Mayank | 4 | 15 | Male |
Panel − It is a 3-dimensional data structure containing heterogeneous data. It is very difficult to represent the panel in graphical representation, but it can be illustrated as a container of DataFrame.
The following table gives us the dimension and description about above mentioned data structures used in Pandas −
| Data Structure | Dimension | Description |
|---|---|---|
| Series | 1-D | Size immutable, 1-D homogeneous data |
| DataFrames | 2-D | Size Mutable, Heterogeneous data in tabular form |
| Panel | 3-D | Size-mutable array, container of DataFrame. |
We can understand these data structures as the higher dimensional data structure is the container of lower dimensional data structure.
Installation and Execution
If you are using Anaconda distribution, then no need to install Pandas separately as it is already installed with it. You just need to import the package into your Python script with the help of following −
import pandas as pd
On the other hand, if you are using standard Python distribution then Pandas can be installed using popular python package installer, pip.
pip install Pandas
After installing Pandas, you can import it into your Python script as did above.
Example
The following is an example of creating a series from ndarray by using Pandas −
In [1]: import pandas as pd
In [2]: import numpy as np
In [3]: data = np.array(['g','a','u','r','a','v'])
In [4]: s = pd.Series(data)
In [5]: print (s)
0 g
1 a
2 u
3 r
4 a
5 v
dtype: object
For more detailed study of Pandas you can go to the link www.tutorialspoint.com/python_pandas/index.htm.
Scikit-learn
Another useful and most important python library for Data Science and machine learning in Python is Scikit-learn. The following are some features of Scikit-learn that makes it so useful −
It is built on NumPy, SciPy, and Matplotlib.
It is an open source and can be reused under BSD license.
It is accessible to everybody and can be reused in various contexts.
Wide range of machine learning algorithms covering major areas of ML like classification, clustering, regression, dimensionality reduction, model selection etc. can be implemented with the help of it.
Installation and Execution
If you are using Anaconda distribution, then no need to install Scikit-learn separately as it is already installed with it. You just need to use the package into your Python script. For example, with following line of script we are importing dataset of breast cancer patients from Scikit-learn −
from sklearn.datasets import load_breast_cancer
On the other hand, if you are using standard Python distribution and having NumPy and SciPy then Scikit-learn can be installed using popular python package installer, pip.
pip install -U scikit-learn
After installing Scikit-learn, you can use it into your Python script as you have done above.
