- ML - Home
- ML - Introduction
- ML - Getting Started
- ML - Basic Concepts
- ML - Ecosystem
- ML - Python Libraries
- ML - Applications
- ML - Life Cycle
- ML - Required Skills
- ML - Implementation
- ML - Challenges & Common Issues
- ML - Limitations
- ML - Reallife Examples
- ML - Data Structure
- ML - Mathematics
- ML - Artificial Intelligence
- ML - Neural Networks
- ML - Deep Learning
- ML - Getting Datasets
- ML - Categorical Data
- ML - Data Loading
- ML - Data Understanding
- ML - Data Preparation
- ML - Models
- ML - Supervised Learning
- ML - Unsupervised Learning
- ML - Semi-supervised Learning
- ML - Reinforcement Learning
- ML - Supervised vs. Unsupervised
- Machine Learning Data Visualization
- ML - Data Visualization
- ML - Histograms
- ML - Density Plots
- ML - Box and Whisker Plots
- ML - Correlation Matrix Plots
- ML - Scatter Matrix Plots
- Statistics for Machine Learning
- ML - Statistics
- ML - Mean, Median, Mode
- ML - Standard Deviation
- ML - Percentiles
- ML - Data Distribution
- ML - Skewness and Kurtosis
- ML - Bias and Variance
- ML - Hypothesis
- Regression Analysis In ML
- ML - Regression Analysis
- ML - Linear Regression
- ML - Simple Linear Regression
- ML - Multiple Linear Regression
- ML - Polynomial Regression
- Classification Algorithms In ML
- ML - Classification Algorithms
- ML - Logistic Regression
- ML - K-Nearest Neighbors (KNN)
- ML - Naïve Bayes Algorithm
- ML - Decision Tree Algorithm
- ML - Support Vector Machine
- ML - Random Forest
- ML - Confusion Matrix
- ML - Stochastic Gradient Descent
- Clustering Algorithms In ML
- ML - Clustering Algorithms
- ML - Centroid-Based Clustering
- ML - K-Means Clustering
- ML - K-Medoids Clustering
- ML - Mean-Shift Clustering
- ML - Hierarchical Clustering
- ML - Density-Based Clustering
- ML - DBSCAN Clustering
- ML - OPTICS Clustering
- ML - HDBSCAN Clustering
- ML - BIRCH Clustering
- ML - Affinity Propagation
- ML - Distribution-Based Clustering
- ML - Agglomerative Clustering
- Dimensionality Reduction In ML
- ML - Dimensionality Reduction
- ML - Feature Selection
- ML - Feature Extraction
- ML - Backward Elimination
- ML - Forward Feature Construction
- ML - High Correlation Filter
- ML - Low Variance Filter
- ML - Missing Values Ratio
- ML - Principal Component Analysis
- Reinforcement Learning
- ML - Reinforcement Learning Algorithms
- ML - Exploitation & Exploration
- ML - Q-Learning
- ML - REINFORCE Algorithm
- ML - SARSA Reinforcement Learning
- ML - Actor-critic Method
- ML - Monte Carlo Methods
- ML - Temporal Difference
- Deep Reinforcement Learning
- ML - Deep Reinforcement Learning
- ML - Deep Reinforcement Learning Algorithms
- ML - Deep Q-Networks
- ML - Deep Deterministic Policy Gradient
- ML - Trust Region Methods
- Quantum Machine Learning
- ML - Quantum Machine Learning
- ML - Quantum Machine Learning with Python
- Machine Learning Miscellaneous
- ML - Performance Metrics
- ML - Automatic Workflows
- ML - Boost Model Performance
- ML - Gradient Boosting
- ML - Bootstrap Aggregation (Bagging)
- ML - Cross Validation
- ML - AUC-ROC Curve
- ML - Grid Search
- ML - Data Scaling
- ML - Train and Test
- ML - Association Rules
- ML - Apriori Algorithm
- ML - Gaussian Discriminant Analysis
- ML - Cost Function
- ML - Bayes Theorem
- ML - Precision and Recall
- ML - Adversarial
- ML - Stacking
- ML - Epoch
- ML - Perceptron
- ML - Regularization
- ML - Overfitting
- ML - P-value
- ML - Entropy
- ML - MLOps
- ML - Data Leakage
- ML - Monetizing Machine Learning
- ML - Types of Data
- Machine Learning - Resources
- ML - Quick Guide
- ML - Cheatsheet
- ML - Interview Questions
- ML - Useful Resources
- ML - Discussion
Machine Learning - K-Means Clustering Algorithm
K-Means Clustering Algorithm
K-means clustering algorithm computes the centroids and iterates until we it finds optimal centroid. It assumes that the number of clusters are already known. It is also called flat clustering algorithm. The number of clusters identified from data by algorithm is represented by 'K' in K-means.
In this algorithm, the data points are assigned to a cluster in such a manner that the sum of the squared distance between the data points and centroid would be minimum. It is to be understood that less variation within the clusters will lead to more similar data points within same cluster.
Working of K-Means Algorithm
We can understand the working of K-Means clustering algorithm with the help of following steps −
- Step 1 − First, we need to specify the number of clusters, K, need to be generated by this algorithm.
- Step 2 − Next, randomly select K data points and assign each data point to a cluster. In simple words, classify the data based on the number of data points.
- Step 3 − Now it will compute the cluster centroids.
- Step 4 − Next, keep iterating the following until we find optimal centroid which is the assignment of data points to the clusters that are not changing any more −
4.1 − First, the sum of squared distance between data points and centroids would be computed.
4.2 − Now, we have to assign each data point to the cluster that is closer than other cluster (centroid).
4.3 − At last compute the centroids for the clusters by taking the average of all data points of that cluster.
K-means follows Expectation-Maximization approach to solve the problem. The Expectation-step is used for assigning the data points to the closest cluster and the Maximization-step is used for computing the centroid of each cluster.
While working with K-means algorithm we need to take care of the following things −
- While working with clustering algorithms including K-Means, it is recommended to standardize the data because such algorithms use distance-based measurement to determine the similarity between data points.
- Due to the iterative nature of K-Means and random initialization of centroids, K-Means may stick in a local optimum and may not converge to global optimum. That is why it is recommended to use different initializations of centroids.
The K-Means algorithm is a straightforward and efficient algorithm, and it can handle large datasets. However, it has some limitations, such as its sensitivity to the initial centroids, its tendency to converge to local optima, and its assumption of equal variance for all clusters.
Objective of K-means Clustering
The main goals of cluster analysis are −
- To get a meaningful intuition from the data we are working with.
- Cluster-then-predict where different models will be built for different subgroups.
Implementation of K-Means Algorithm Using Python
Python has several libraries that provide implementations of various machine learning algorithms, including K-Means clustering. Let's see how to implement the K-Means algorithm in Python using the scikit-learn library.
Example - Understanding K-Means Algorithm
It is a simple example to understand how k-means works. In this example, we generate 300 random data points with two features. And apply K-means algorithm to generate clusters.
Step 1 − Import Required Libraries
To implement the K-Means algorithm in Python, we first need to import the required libraries. We will use the numpy and matplotlib libraries for data processing and visualization, respectively, and the scikit-learn library for the K-Means algorithm.
import numpy as np
import matplotlib.pyplot as plt
from sklearn.cluster import KMeans
Step 2 − Generate Data
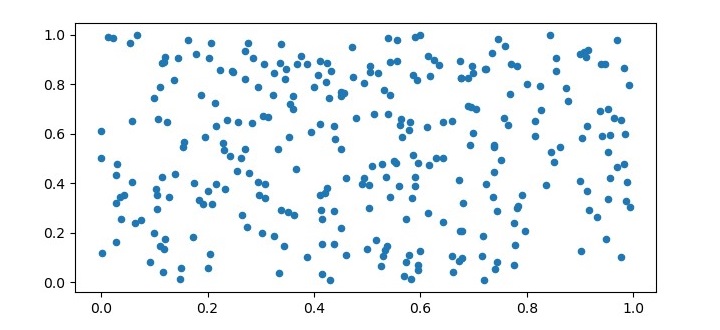
To test the K-Means algorithm, we need to generate some sample data. In this example, we will generate 300 random data points with two features. We will visualize the data also.
X = np.random.rand(300,2)

plt.figure(figsize=(7.5, 3.5))
plt.scatter(X[:, 0], X[:, 1], s=20);
plt.show()
Complete Code
import numpy as np
import matplotlib.pyplot as plt
from sklearn.cluster import KMeans

X = np.random.rand(300,2)

plt.figure(figsize=(7.5, 3.5))
plt.scatter(X[:, 0], X[:, 1], s=20);
plt.show()
Output
Step 3 − Initialize K-Means
Next, we need to initialize the K-Means algorithm by specifying the number of clusters (K) and the maximum number of iterations.
kmeans = KMeans(n_clusters=3, max_iter=100)
Step 4 − Train the Model
After initializing the K-Means algorithm, we can train the model by fitting the data to the algorithm.
kmeans.fit(X)
Step 5 − Visualize the Clusters
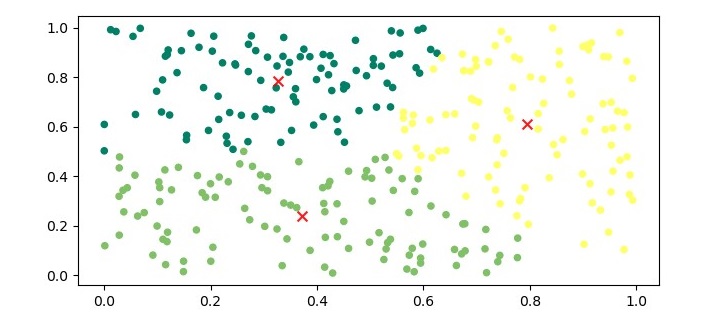
To visualize the clusters, we can plot the data points and color them based on their assigned cluster.
plt.figure(figsize=(7.5, 3.5))
plt.scatter(X[:,0], X[:,1], c=kmeans.labels_, s=20)
plt.scatter(kmeans.cluster_centers_[:,0], kmeans.cluster_centers_[:,1],
marker='x', c='r', s=50, alpha=0.9)
plt.show()
Complete Code
import numpy as np
import matplotlib.pyplot as plt
from sklearn.cluster import KMeans

X = np.random.rand(300,2)

kmeans = KMeans(n_clusters=3, max_iter=100)
kmeans.fit(X)

plt.figure(figsize=(7.5, 3.5))
plt.scatter(X[:,0], X[:,1], c=kmeans.labels_, s=20)
plt.scatter(kmeans.cluster_centers_[:,0], kmeans.cluster_centers_[:,1],
marker='x', c='r', s=50, alpha=0.9)
plt.show()
Output
The output of the above code will be a plot with the data points colored based on their assigned cluster, and the centroids marked with an 'x' symbol in red color.
Example - Using 2D Datasets
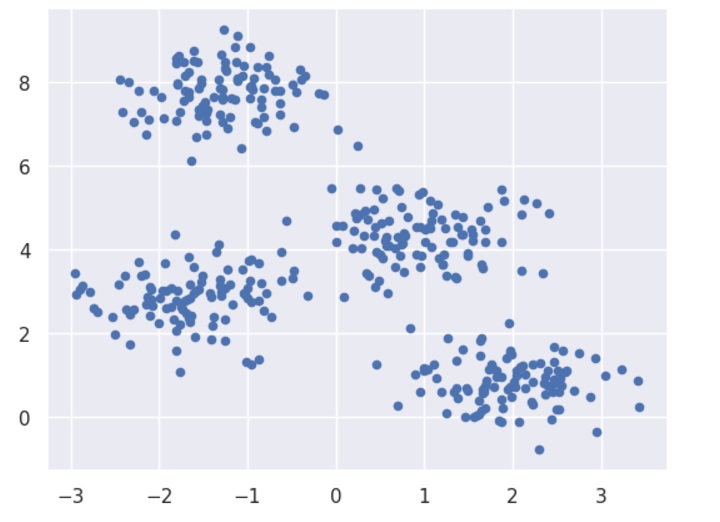
In this example, we are going to first generate 2D dataset containing 4 different blobs and after that will apply k-means algorithm to see the result.
First, we will start by importing the necessary packages −
import matplotlib.pyplot as plt
import seaborn as sns; sns.set()
import numpy as np
from sklearn.cluster import KMeans
The following code will generate the 2D, containing four blobs −
from sklearn.datasets import make_blobs
X, y_true = make_blobs(n_samples=400, centers=4, cluster_std=0.60, random_state=0)
Next, the following code will help us to visualize the dataset −
plt.scatter(X[:, 0], X[:, 1], s=20);
plt.show()
Complete Code
import matplotlib.pyplot as plt
import numpy as np
from sklearn.cluster import KMeans

from sklearn.datasets import make_blobs
X, y_true = make_blobs(n_samples=400, centers=4, cluster_std=0.60, random_state=0)

plt.scatter(X[:, 0], X[:, 1], s=20);
plt.show()
Output
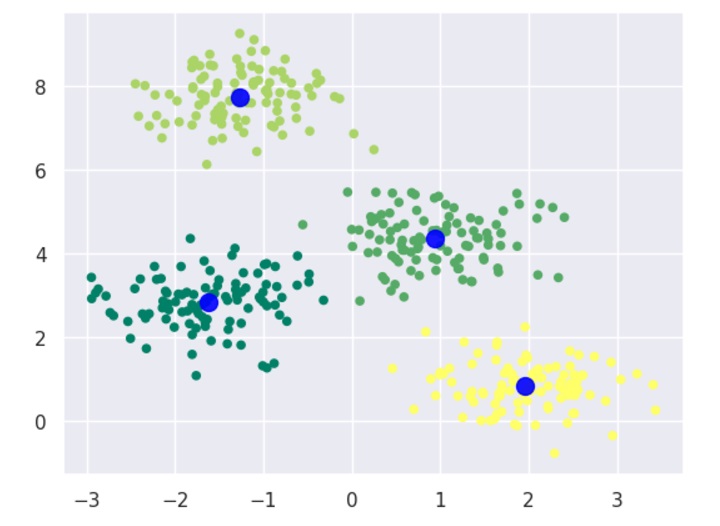
Next, make an object of KMeans along with providing number of clusters, train the model and do the prediction as follows −
kmeans = KMeans(n_clusters=4)
kmeans.fit(X)
y_kmeans = kmeans.predict(X)
Now, with the help of following code we can plot and visualize the cluster's centers picked by k-means Python estimator −
import matplotlib.pyplot as plt
import numpy as np
from sklearn.cluster import KMeans

kmeans = KMeans(n_clusters=4)
kmeans.fit(X)
y_kmeans = kmeans.predict(X)

plt.scatter(X[:, 0], X[:, 1], c=y_kmeans, s=20)
centers = kmeans.cluster_centers_
plt.scatter(centers[:, 0], centers[:, 1], c='blue', s=100, alpha=0.9);
plt.show()
Example - Using Single Digit Dataset
Let us move to another example in which we are going to apply K-means clustering on simple digits dataset. K-means will try to identify similar digits without using the original label information.
First, we will start by importing the necessary packages −
import matplotlib.pyplot as plt
import numpy as np
from sklearn.cluster import KMeans
Next, load the digit dataset from sklearn and make an object of it. We can also find number of rows and columns in this dataset as follows −
import matplotlib.pyplot as plt
import numpy as np
from sklearn.cluster import KMeans

from sklearn.datasets import load_digits
digits = load_digits()
digits.data.shape
Output
(1797, 64)
The above output shows that this dataset is having 1797 samples with 64 features.
We can perform the clustering as we did in Example 1 above −
import matplotlib.pyplot as plt
import numpy as np
from sklearn.cluster import KMeans

from sklearn.datasets import load_digits
digits = load_digits()
digits.data.shape

kmeans = KMeans(n_clusters=10, random_state=0)
clusters = kmeans.fit_predict(digits.data)
kmeans.cluster_centers_.shape
Output
(10, 64)
The above output shows that K-means created 10 clusters with 64 features.
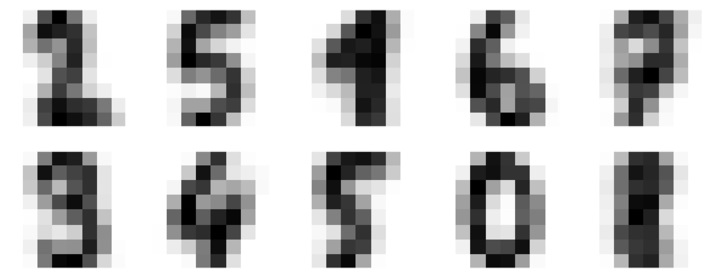
import matplotlib.pyplot as plt
import numpy as np
from sklearn.cluster import KMeans

from sklearn.datasets import load_digits
digits = load_digits()
digits.data.shape

kmeans = KMeans(n_clusters=10, random_state=0)
clusters = kmeans.fit_predict(digits.data)
kmeans.cluster_centers_.shape

fig, ax = plt.subplots(2, 5, figsize=(8, 3))
centers = kmeans.cluster_centers_.reshape(10, 8, 8)
for axi, center in zip(ax.flat, centers):
   axi.set(xticks=[], yticks=[])
   axi.imshow(center, interpolation='nearest', cmap=plt.cm.binary)
Output
As output, we will get following image showing clusters centers learned by k-means.
The following lines of code will match the learned cluster labels with the true labels found in them −
from scipy.stats import mode
labels = np.zeros_like(clusters)
for i in range(10):
   mask = (clusters == i)
   labels[mask] = mode(digits.target[mask])[0]
Next, we can check the accuracy as follows −
from sklearn.metrics import accuracy_score
accuracy_score(digits.target, labels)
Output
0.7935447968836951
The above output shows that the accuracy is around 80%.
Advantages of K-Means Clustering Algorithm
The following are some advantages of K-Means clustering algorithms −
- It is very easy to understand and implement.
- If we have large number of variables then, K-means would be faster than Hierarchical clustering.
- On re-computation of centroids, an instance can change the cluster.
- Tighter clusters are formed with K-means as compared to Hierarchical clustering.
Disadvantages of K-Means Clustering Algorithm
The following are some disadvantages of K-Means clustering algorithms −
- It is a bit difficult to predict the number of clusters i.e. the value of k.
- Output is strongly impacted by initial inputs like number of clusters (value of k).
- Order of data will have strong impact on the final output.
- It is very sensitive to rescaling. If we will rescale our data by means of normalization or standardization, then the output will completely change.final output.
- It is not good in doing clustering job if the clusters have a complicated geometric shape.
Applications of K-Means Clustering
K-Means clustering is a versatile algorithm with various applications in several fields. Here we have highlighted some of the important applications −
Image Segmentation
K-Means clustering can be used to segment an image into different regions based on the color or texture of the pixels. This technique is widely used in computer vision applications, such as object recognition, image retrieval, and medical imaging.
Customer Segmentation
K-Means clustering can be used to segment customers into different groups based on their purchasing behavior or demographic characteristics. This technique is widely used in marketing applications, such as customer retention, loyalty programs, and targeted advertising.
Anomaly Detection
K-Means clustering can be used to detect anomalies in a dataset by identifying data points that do not belong to any cluster. This technique is widely used in fraud detection, network intrusion detection, and predictive maintenance.
Genomic Data Analysis
K-Means clustering can be used to analyze gene expression data to identify different groups of genes that are co-regulated or co-expressed. This technique is widely used in bioinformatics applications, such as drug discovery, disease diagnosis, and personalized medicine.
