- ML - Home
- ML - Introduction
- ML - Getting Started
- ML - Basic Concepts
- ML - Ecosystem
- ML - Python Libraries
- ML - Applications
- ML - Life Cycle
- ML - Required Skills
- ML - Implementation
- ML - Challenges & Common Issues
- ML - Limitations
- ML - Reallife Examples
- ML - Data Structure
- ML - Mathematics
- ML - Artificial Intelligence
- ML - Neural Networks
- ML - Deep Learning
- ML - Getting Datasets
- ML - Categorical Data
- ML - Data Loading
- ML - Data Understanding
- ML - Data Preparation
- ML - Models
- ML - Supervised Learning
- ML - Unsupervised Learning
- ML - Semi-supervised Learning
- ML - Reinforcement Learning
- ML - Supervised vs. Unsupervised
- Machine Learning Data Visualization
- ML - Data Visualization
- ML - Histograms
- ML - Density Plots
- ML - Box and Whisker Plots
- ML - Correlation Matrix Plots
- ML - Scatter Matrix Plots
- Statistics for Machine Learning
- ML - Statistics
- ML - Mean, Median, Mode
- ML - Standard Deviation
- ML - Percentiles
- ML - Data Distribution
- ML - Skewness and Kurtosis
- ML - Bias and Variance
- ML - Hypothesis
- Regression Analysis In ML
- ML - Regression Analysis
- ML - Linear Regression
- ML - Simple Linear Regression
- ML - Multiple Linear Regression
- ML - Polynomial Regression
- Classification Algorithms In ML
- ML - Classification Algorithms
- ML - Logistic Regression
- ML - K-Nearest Neighbors (KNN)
- ML - Naïve Bayes Algorithm
- ML - Decision Tree Algorithm
- ML - Support Vector Machine
- ML - Random Forest
- ML - Confusion Matrix
- ML - Stochastic Gradient Descent
- Clustering Algorithms In ML
- ML - Clustering Algorithms
- ML - Centroid-Based Clustering
- ML - K-Means Clustering
- ML - K-Medoids Clustering
- ML - Mean-Shift Clustering
- ML - Hierarchical Clustering
- ML - Density-Based Clustering
- ML - DBSCAN Clustering
- ML - OPTICS Clustering
- ML - HDBSCAN Clustering
- ML - BIRCH Clustering
- ML - Affinity Propagation
- ML - Distribution-Based Clustering
- ML - Agglomerative Clustering
- Dimensionality Reduction In ML
- ML - Dimensionality Reduction
- ML - Feature Selection
- ML - Feature Extraction
- ML - Backward Elimination
- ML - Forward Feature Construction
- ML - High Correlation Filter
- ML - Low Variance Filter
- ML - Missing Values Ratio
- ML - Principal Component Analysis
- Reinforcement Learning
- ML - Reinforcement Learning Algorithms
- ML - Exploitation & Exploration
- ML - Q-Learning
- ML - REINFORCE Algorithm
- ML - SARSA Reinforcement Learning
- ML - Actor-critic Method
- ML - Monte Carlo Methods
- ML - Temporal Difference
- Deep Reinforcement Learning
- ML - Deep Reinforcement Learning
- ML - Deep Reinforcement Learning Algorithms
- ML - Deep Q-Networks
- ML - Deep Deterministic Policy Gradient
- ML - Trust Region Methods
- Quantum Machine Learning
- ML - Quantum Machine Learning
- ML - Quantum Machine Learning with Python
- Machine Learning Miscellaneous
- ML - Performance Metrics
- ML - Automatic Workflows
- ML - Boost Model Performance
- ML - Gradient Boosting
- ML - Bootstrap Aggregation (Bagging)
- ML - Cross Validation
- ML - AUC-ROC Curve
- ML - Grid Search
- ML - Data Scaling
- ML - Train and Test
- ML - Association Rules
- ML - Apriori Algorithm
- ML - Gaussian Discriminant Analysis
- ML - Cost Function
- ML - Bayes Theorem
- ML - Precision and Recall
- ML - Adversarial
- ML - Stacking
- ML - Epoch
- ML - Perceptron
- ML - Regularization
- ML - Overfitting
- ML - P-value
- ML - Entropy
- ML - MLOps
- ML - Data Leakage
- ML - Monetizing Machine Learning
- ML - Types of Data
- Machine Learning - Resources
- ML - Quick Guide
- ML - Cheatsheet
- ML - Interview Questions
- ML - Useful Resources
- ML - Discussion
Machine Learning - Mean-Shift Clustering Algorithm
Mean-Shift Clustering Algorithm
The Mean-Shift clustering algorithm is a non-parametric clustering algorithm that works by iteratively shifting the mean of a data point towards the densest area of the data. The densest area of the data is determined by the kernel function, which is a function that assigns weights to the data points based on their distance from the mean. The kernel function used in Mean-Shift clustering is usually a Gaussian function.
The Mean-Shift clustering algorithm is a powerful clustering algorithm used in unsupervised learning. Unlike K-means clustering, it does not make any assumptions; hence it is a non-parametric algorithm.
The difference between K-Means algorithm and Mean-Shift is that later one does not need to specify the number of clusters in advance because the number of clusters will be determined by the algorithm w.r.t data.
Working of Mean-Shift Algorithm
We can understand the working of Mean-Shift clustering algorithm with the help of following steps −
- Step 1 − First, start with the data points assigned to a cluster of their own.
- Step 2 − Next, this algorithm will compute the centroids.
- Step 3 − In this step, location of new centroids will be updated.
- Step 4 − Now, the process will be iterated and moved to the higher density region.
- Step 5 − At last, it will be stopped once the centroids reach at position from where it cannot move further.
The Mean-Shift clustering algorithm is a density-based clustering algorithm, which means that it identifies clusters based on the density of the data points rather than the distance between them. In other words, the algorithm identifies clusters based on the areas where the density of the data points is highest.
Implementation of Mean-Shift Clustering in Python
The Mean-Shift clustering algorithm can be implemented in Python programming language using the scikit-learn library. The scikit-learn library is a popular machine learning library in Python that provides various tools for data analysis and machine learning. The following steps are involved in implementing the Mean-Shift clustering algorithm in Python using the scikit-learn library −
Step 1 − Import the necessary libraries
The numpy library is used for scientific computing in Python, while the matplotlib library is used for data visualization. The sklearn.cluster library contains the MeanShift class, which is used for implementing the Mean-Shift clustering algorithm in Python.
The estimate_bandwidth function is used to estimate the bandwidth of the kernel function, which is an important parameter in the Mean-Shift clustering algorithm.
import numpy as np
import matplotlib.pyplot as plt
from sklearn.cluster import MeanShift, estimate_bandwidth
Step 2 − Generate the data
In this step, we generate a random dataset with 500 data points and 2 features. We use the numpy.random.randn function to generate the data.
# Generate the data
X = np.random.randn(500,2)
Step 3 − Estimate the bandwidth of the kernel function
In this step, we estimate the bandwidth of the kernel function using the estimate_bandwidth function. The bandwidth is an important parameter in the Mean-Shift clustering algorithm, which determines the width of the kernel function.
# Estimate the bandwidth
bandwidth = estimate_bandwidth(X, quantile=0.1, n_samples=100)
Step 4 − Initialize the Mean-Shift clustering algorithm
In this step, we initialize the Mean-Shift clustering algorithm using the MeanShift class. We pass the bandwidth parameter to the class to set the width of the kernel function.
# Initialize the Mean-Shift algorithm
ms = MeanShift(bandwidth=bandwidth, bin_seeding=True)
Step 5 − Train the model
In this step, we train the Mean-Shift clustering algorithm on the dataset using the fit method of the MeanShift class.
# Train the model
ms.fit(X)
Step 6 − Visualize the results
# Visualize the results
labels = ms.labels_
cluster_centers = ms.cluster_centers_
n_clusters_ = len(np.unique(labels))
print("Number of estimated clusters:", n_clusters_)

# Plot the data points and the centroids
plt.figure(figsize=(7.5, 3.5))
plt.scatter(X[:,0], X[:,1], c=labels, cmap='viridis')
plt.scatter(cluster_centers[:,0], cluster_centers[:,1], marker='*', s=300, c='r')
plt.show()
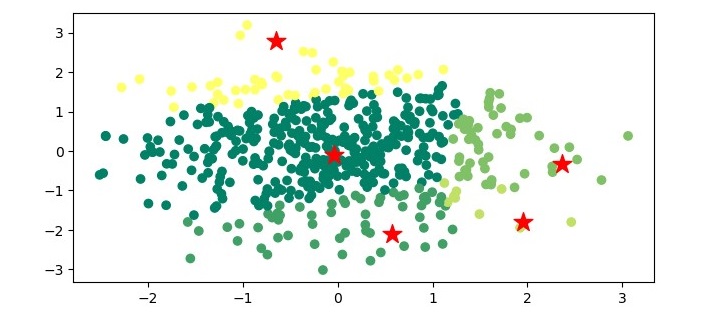
In this step, we visualize the results of the Mean-Shift clustering algorithm. We extract the cluster labels and the cluster centers from the trained model. We then print the number of estimated clusters. Finally, we plot the data points and the centroids using the matplotlib library.
Example - Mean-Shift Clustering Algorithm
Here is the complete implementation example of Mean-Shift Clustering Algorithm in python −
import numpy as np
import matplotlib.pyplot as plt
from sklearn.cluster import MeanShift, estimate_bandwidth

# Generate the data
X = np.random.randn(500,2)

# Estimate the bandwidth
bandwidth = estimate_bandwidth(X, quantile=0.1, n_samples=100)

# Initialize the Mean-Shift algorithm
ms = MeanShift(bandwidth=bandwidth, bin_seeding=True)

# Train the model
ms.fit(X)

# Visualize the results
labels = ms.labels_
cluster_centers = ms.cluster_centers_
n_clusters_ = len(np.unique(labels))
print("Number of estimated clusters:", n_clusters_)

# Plot the data points and the centroids
plt.figure(figsize=(7.5, 3.5))
plt.scatter(X[:,0], X[:,1], c=labels, cmap='summer')
plt.scatter(cluster_centers[:,0], cluster_centers[:,1], marker='*',
s=200, c='r')
plt.show()
Output
When you execute the program, it will produce the following plot as the output −
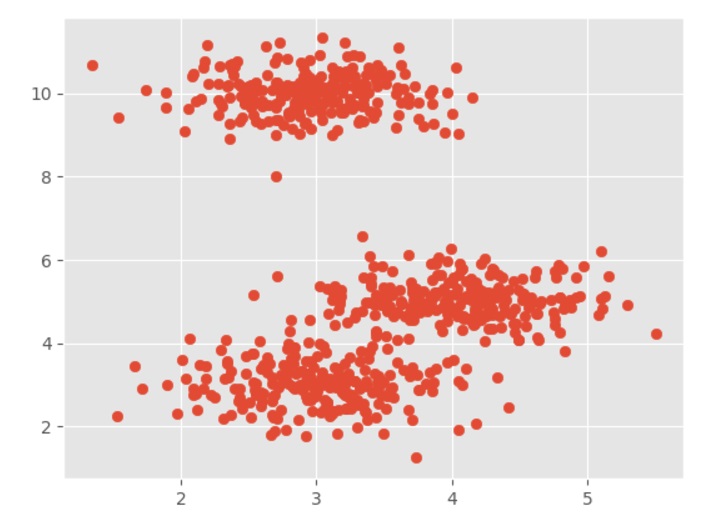
Example - Mean-Shift Clustering Algorithm using 2D dataset
It is a simple example to understand how Mean-Shift algorithm works. In this example, we are going to first generate 2D dataset containing 4 different blobs and after that will apply Mean-Shift algorithm to see the result.
import numpy as np
from sklearn.cluster import MeanShift
import matplotlib.pyplot as plt
from matplotlib import style
style.use("ggplot")
from sklearn.datasets import make_blobs
centers = [[3,3,3],[4,5,5],[3,10,10]]
X, _ = make_blobs(n_samples = 700, centers = centers, cluster_std = 0.5)
plt.scatter(X[:,0],X[:,1])
plt.show()
Output
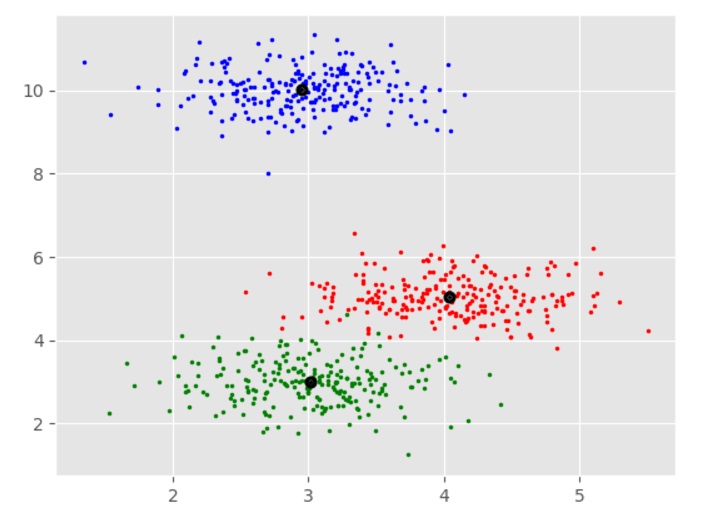
Example - Mean-Shift Clustering Algorithm using Clusters
import numpy as np
from sklearn.cluster import MeanShift
import matplotlib.pyplot as plt

ms = MeanShift()
ms.fit(X)
labels = ms.labels_
cluster_centers = ms.cluster_centers_
print(cluster_centers)
n_clusters_ = len(np.unique(labels))
print("Estimated clusters:", n_clusters_)
colors = 10*['r.','g.','b.','c.','k.','y.','m.']
for i in range(len(X)):
    plt.plot(X[i][0], X[i][1], colors[labels[i]], markersize = 3)
plt.scatter(cluster_centers[:,0],cluster_centers[:,1],
    marker=".",color='k', s=20, linewidths = 5, zorder=10)
plt.show()
Output
[[ 4.03457771  5.03063843  4.92928409]
 [ 3.01124859  2.9957586   2.981767  ]
 [ 2.94969928 10.00712673 10.01575558]]
Estimated clusters: 3
Applications of Mean-Shift Clustering
The Mean-Shift clustering algorithm has several applications in various fields. Some of the applications of Mean-Shift clustering are as follows −
- Computer vision − Mean-Shift clustering is widely used in computer vision for object tracking, image segmentation, and feature extraction.
- Image processing − Mean-Shift clustering is used for image segmentation, which is the process of dividing an image into multiple segments based on the similarity of the pixels.
- Anomaly detection − Mean-Shift clustering can be used for detecting anomalies in data by identifying the areas with low density.
- Customer segmentation − Mean-Shift clustering can be used for customer segmentation in marketing by identifying groups of customers with similar behavior and preferences.
- Social network analysis − Mean-Shift clustering can be used for clustering users in social networks based on their interests and interactions.
Advantages and Disadvantages
Let's discuss some advantages and disadvantages of the means-shift clustering algorithm.
Advantages
The following are some advantages of Mean-Shift clustering algorithm −
- It does not need to make any model assumption as like in K-means or Gaussian mixture.
- It can also model the complex clusters which have nonconvex shape.
- It only needs one parameter named bandwidth which automatically determines the number of clusters.
- There is no issue of local minima as like in K-means.
- No problem generated from outliers.
Disadvantages
The following are some disadvantages of Mean-Shift clustering algorithm −
- Mean-shift algorithm does not work well in case of high dimension, where number of clusters changes abruptly.
- We do not have any direct control on the number of clusters but in some applications, we need a specific number of clusters.
- It cannot differentiate between meaningful and meaningless modes.
