
Article Categories
- All Categories
-
 Data Structure
-
 Networking
-
 RDBMS
RDBMS
-
 Operating System
-
 Java
Java
-
 MS Excel
-
 iOS
iOS
-
 HTML
HTML
-
 CSS
CSS
-
 Android
-
 Python
-
 C Programming
-
 C++
C++
-
 C#
C#
-
 MongoDB
-
 MySQL
MySQL
-
 Javascript
-
 PHP
PHP
-
 Economics & Finance
Selected Reading
How to set the alignment of labels in horizontal bar plot to left in R?
When we create a horizontal bar plot using ggplot2 package, the labels of the categorical variable are aligned to the right-side of the axis and if the size of these labels are different then it looks a little ambiguous. Therefore, we might want to set the alignment of the labels to left-side and this can be done by using theme function of ggplot2 package.
Example
Consider the below data frame:
> df<-data.frame(x,y)
> df
Output
    x     y
1 India  14
2 UK     15
3 Russia 12
4 United States of America 18
Loading ggplot2 package and creating a horizontal bar plot:
Example
> library(ggplot2)
> ggplot(df,aes(x,y))+geom_bar(stat="identity")+coord_flip()
Output:
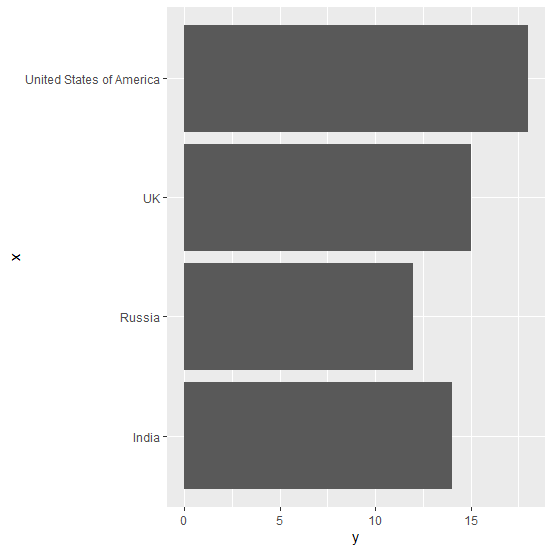
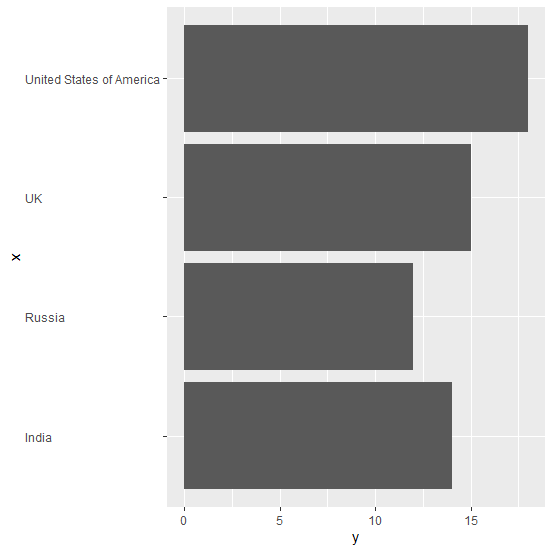
Creating the horizontal bar plot with categorical variable labels aligned to left-side:
Example
> ggplot(df,aes(x,y))+geom_bar(stat="identity")+coord_flip()+theme(axis.text.y=element_text(hjust=0))
Output:

Updated on: 2020-11-06T12:00:15+05:30
1K+ Views

Advertisements