
 Data Structure
 Networking
 RDBMS
RDBMS Operating System
 Java
Java MS Excel
 iOS
iOS HTML
HTML CSS
CSS Android
 Python
 C Programming
 C++
C++ C#
C# MongoDB
 MySQL
MySQL Javascript
 PHP
PHP
- Selected Reading
- UPSC IAS Exams Notes
- Developer's Best Practices
- Questions and Answers
- Effective Resume Writing
- HR Interview Questions
- Computer Glossary
- Who is Who
How to set axes labels & limits in a Seaborn plot?
Creating the plots using Seaborn will adjust the labels and axes limitations to make the plots more understandable. The axes labels are the names we can provide to the x and y axes so that others can understand what the plots show. We can focus on select areas of the data that are significant by altering the axes' limitations. Seaborn includes straightforward methods for setting axis labels and boundaries that allow us to make our plots more informative. In Python, we have some built-in functions like xlabel(), ylabel(), xlim(), and, ylim() that can be used to set the axes labels and limits in a Seaborn plot.
Syntax
The following syntax is used in the examples ?
xlabel()
ylabel()
The xlabel() and ylabel() are the built-in functions in Python that set the text on x-axis(horizontal) and y-axis(vertical).
xlim()
ylim()
The xlim() and ylim() are the built-in functions that set the specified range on the x-axis and y-axis respectively.
scatterplot()
The scatterplot() is a built-in method in Python that helps set the dot figure of the graph based on the dataset.
lineplot()
The lineplot() method is used to show the interval of a plot. This is a basic diagram that is mostly used in the machine learning dataset.
barplot()
This is an in-built method in Python that will be used to create the bar graph of a dataset.
histplot()
The histplot() create the diagram based on the histogram according to dataset.
boxplot()
The boxplot() method shows the high-level summary in a standardized way to summarise the data based on the dataset.
Algorithm
The following steps are ?
Step 1 ? Import the seaborn module and take the object reference as sns
Step 2 ? Import the module named matplotlib.pyplot and take reference as plt that helps to set the axes label and limit of Seaborn plot.
Step 3 ? Create the two lists with random data and store it in the variable x and y respectively.
Step 4 ? Then create the plot graph figure according to users choice such as scatterplot(), lineplot(), boxplot(), and, histplot() that accepts two parameters- x( this stores the value as variable x) and y( this store the value as variable y) with object reference sns.
Step 5 ? Next, create the text representation on horizontal(x-axis) and vertical axes(y-axis) by using the built-in methods xlabel() and ylabel() respectively.
Step 6 ? To set the range of graph figure it will use the built-in method xlim() for horizontal axis and y-lim() for vertical axis.
Step 7 ? Finally use the method named show() that will generate the output of the program.
Example 1
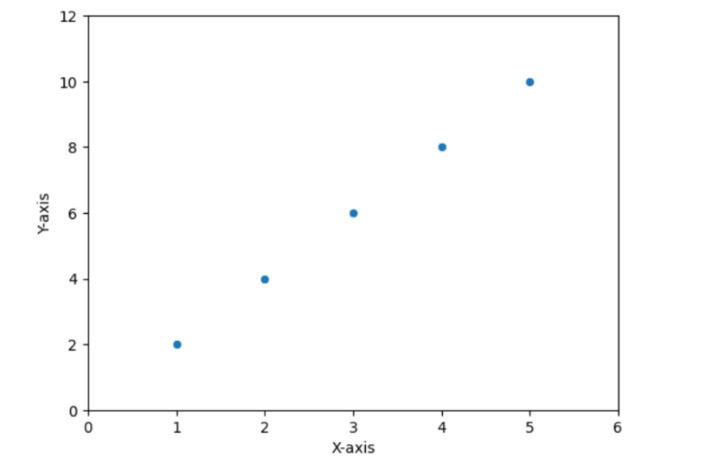
In the following example, we will show how a draw a scatterplot diagram by setting labels and limits. As we know Seaborn library is comfortable working with the matplotlib module and it will generate the diagram according to the given dataset.
# Scatter plot
import seaborn as sns
import matplotlib.pyplot as plt

# Generate some random data
x = [1, 2, 3, 4, 5]
y = [2, 4, 6, 8, 10]

# Create a scatter plot
sns.scatterplot(x=x, y=y)

# Set labels and limits
plt.xlabel('X-axis')
plt.ylabel('Y-axis')
plt.xlim(0, 6)
plt.ylim(0, 12)

# Show the plot
plt.show()
Output
Example 2
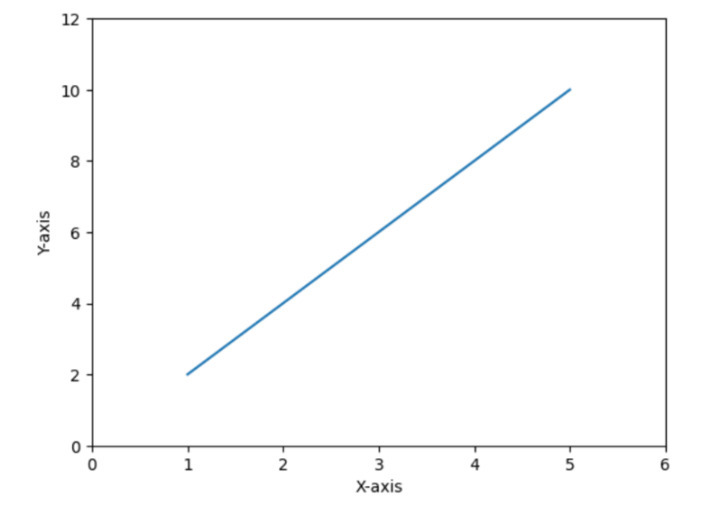
In the following example, we will show how to a lineplot diagram by setting label and limits using Seaborn plot. It also uses the matplotlib submodule i.e. pyplot that helps to plot the graph and generate the output by giving a specific built-in method to it.
import seaborn as sns
import matplotlib.pyplot as plt

# Generate some random data
x = [1, 2, 3, 4, 5]
y = [2, 4, 6, 8, 10]

# Create a line plot
sns.lineplot(x=x, y=y)

# Set labels and limits
plt.xlabel('X-axis')
plt.ylabel('Y-axis')
plt.xlim(0, 6)
plt.ylim(0, 12)

# Show the plot
plt.show()
Output
Example 3
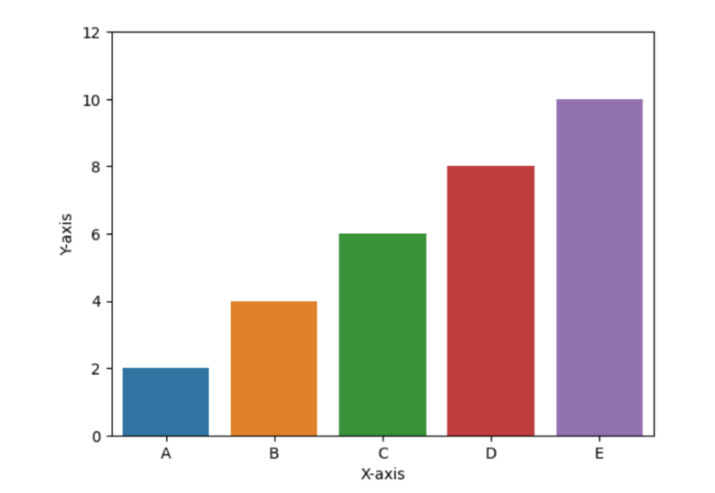
In the following example, we will show the bar graph barplots() and to set the label and axes it has to use the following methods- xlabel(), ylabel(), ylim(). Next, use the show() method to get the result.
# Bar plot
import seaborn as sns
import matplotlib.pyplot as plt

# Generate some random data
x = ['A', 'B', 'C', 'D', 'E']
y = [2, 4, 6, 8, 10]

# Create a bar plot
sns.barplot(x=x, y=y)

# Set labels and limits
plt.xlabel('X-axis')
plt.ylabel('Y-axis')
plt.ylim(0, 12)

# Show the plot
plt.show()
Output
Example 4
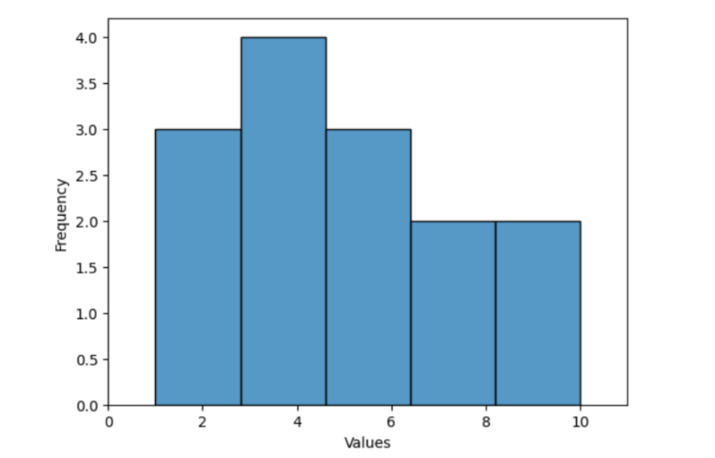
In the following example, we will show how to draw a histogram by using the built-in method histplot() which accepts the parameter as a variable named data which has random data, and using built-in functions like xlabel() and ylabel() it has set the text name on horizontal and vertical axis respectively. Then use the xlim() and ylim() to get the range limit of the integer on the x and y axes respectively. Finally, it will use the method show() to get the output of the program.
import seaborn as sns
import matplotlib.pyplot as plt

# Generate some random data
data = [1, 2, 3, 4, 5, 2, 3, 4, 5, 6, 7, 8, 9, 10]

# Create a histogram
sns.histplot(data)

# Set labels and limits
plt.xlabel('Values')
plt.ylabel('Frequency')
plt.xlim(0, 11)

# Show the plot
plt.show()
Output
Example 5
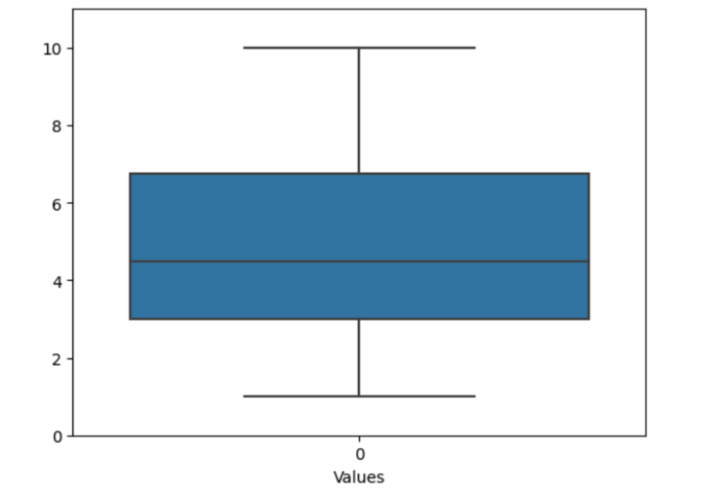
In the following example, we will start the program by importing the modules- seaborn and matplotlib.pyplot that helps to plot the graph diagram. Then it uses the random data using a list to depict the fake data. Next, create the box plot by using the method named boxplot() with object reference sns. Then set the limit only on a vertical axis by using ylim()[set the range of the graph] and set the label only on x-axis by using xlabel()[fill the text to say something on horizontal axis]. Finally, use the method show() to get the output.
import seaborn as sns
import matplotlib.pyplot as plt

# Generate some random data
data = [1, 2, 3, 4, 5, 2, 3, 4, 5, 6, 7, 8, 9, 10]

# Create a box plot
sns.boxplot(data)

# Set labels and limits
plt.xlabel('Values')
plt.ylim(0, 11)

# Show the plot
plt.show()
Output
Conclusion
We discussed the various ways to draw the different types of graphs and using of same built-in functions like xlim(), ylim(), xlabel(), and, ylabel() can set the name of the label along the ranges of the graph figure. The Seaborn plot is generally used to analyze a variety of data visualization patterns.

