
Article Categories
- All Categories
-
 Data Structure
-
 Networking
-
 RDBMS
RDBMS
-
 Operating System
-
 Java
Java
-
 MS Excel
-
 iOS
iOS
-
 HTML
HTML
-
 CSS
CSS
-
 Android
-
 Python
-
 C Programming
-
 C++
C++
-
 C#
C#
-
 MongoDB
-
 MySQL
MySQL
-
 Javascript
-
 PHP
PHP
-
 Economics & Finance
How to rotate X-axis tick labels in Pandas bar plot?
Using plt.xticks(x, labels, rotation='vertical'), we can rotate our tick’s label.
Steps
Create two lists, x, and y.
Create labels with a list of different cities.
Adjust the subplot layout parameters, where bottom = 0.15.
Add a subplot to the current figure, where nrow = 1, ncols = 2 and index = 1.
Plot the line using plt.plot(), using x and y (Step 1).
Get or set the current tick locations and labels of the X-axis. Pass no arguments to return the current values without modifying them, with x and label data.
Set or retrieve auto-scaling margins, value is 0.2.
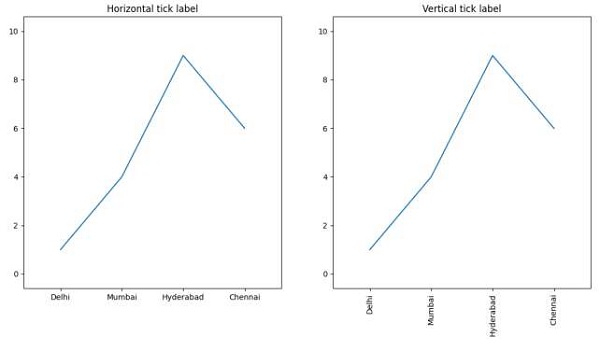
Set the title of the figure at index 1, the title is "Horizontal tick label".
Add a subplot to the current figure, where nrow = 1, ncols = 2 and index = 2.
Plot line using plt.plot() method, using x and y (Step 1).
Get or set the current tick locations and labels of the X-axis. Pass no arguments to return the current values without modifying them, with x, label data, and rotation = ’vertical’.
Set or retrieve auto-scaling margins, value is 0.2.
Set the title of the figure at index 2, the title is "Vertical tick label".
Use plt.show() to show the figure.
Example
import matplotlib.pyplot as plt

x = [1, 2, 3, 4]
y = [1, 4, 9, 6]
labels = ['Delhi', 'Mumbai', 'Hyderabad', 'Chennai']
plt.subplots_adjust(bottom=0.15)

plt.subplot(121)
plt.plot(x, y)
plt.xticks(x, labels)
plt.margins(0.2)
plt.title("Horizontal tick label")

plt.subplot(122)
plt.plot(x, y)
plt.xticks(x, labels, rotation='vertical')
plt.margins(0.2)
plt.title("Vertical tick label")

plt.show()
Output

8K+ Views
