
Article Categories
- All Categories
-
 Data Structure
-
 Networking
-
 RDBMS
RDBMS
-
 Operating System
-
 Java
Java
-
 MS Excel
-
 iOS
iOS
-
 HTML
HTML
-
 CSS
CSS
-
 Android
-
 Python
-
 C Programming
-
 C++
C++
-
 C#
C#
-
 MongoDB
-
 MySQL
MySQL
-
 Javascript
-
 PHP
PHP
-
 Economics & Finance
Selected Reading
How to increase the space between horizontal legends using ggplot2 in R?
Generally, the space between two legend entries is not large enough and it becomes difficult to read the legend names if the names are long. In this case, we need to increase the margin between the legend entries/names but this would be required when the legends are horizontally aligned as vertical legends can be read as it is. For this purpose, we can use legend.text argument inside theme function of ggplot2 package.
Example
Consider the below data frame −
> x<-c("Male","Female")
> y<-c(501,520)
> df<-data.frame(x,y)
> df
Output
    x     y
1 Male   501
2 Female 520
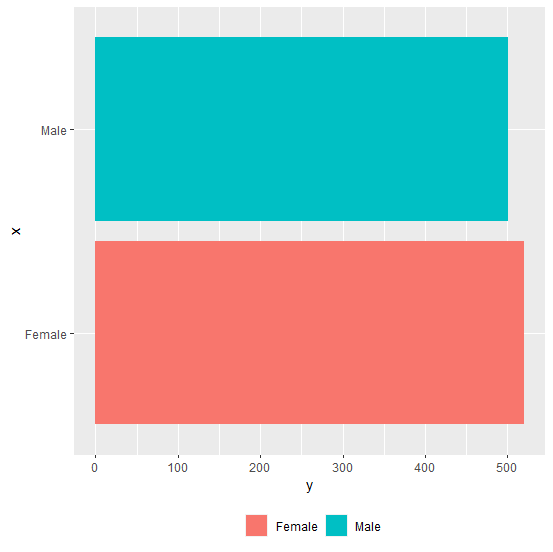
Loading ggplot2 package and creating a horizontal bar graph −
Example
> library(ggplot2)
> ggplot(df,aes(x,y,fill=x))+geom_bar(stat="identity")+coord_flip()+theme(legend.position="bottom")+guides(fill=guide_legend(title=NULL))
Output
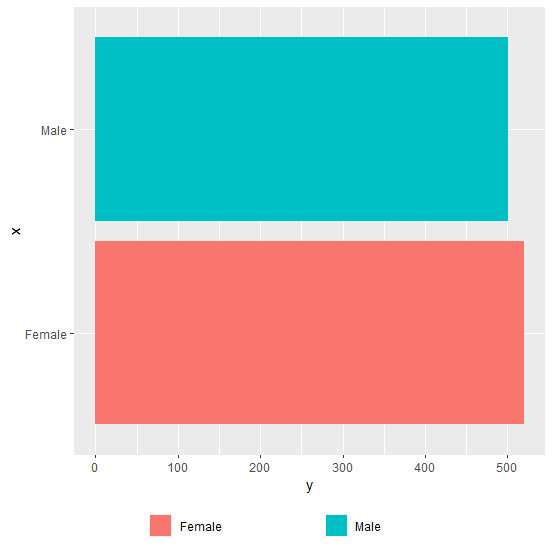
Creating the plot with a larger space between legend entries −
Example
> ggplot(df,aes(x,y,fill=x))+geom_bar(stat="identity")+coord_flip()+theme(legend.position="bottom",legend.text=element_text(margin=margin(r=1,unit="inch")))+guides(fill=guide_legend(title=NULL))
Output

Updated on: 2026-03-11T22:50:54+05:30
4K+ Views

Advertisements