 Data Structure
 Networking
 RDBMS
RDBMS Operating System
 Java
Java MS Excel
 iOS
iOS HTML
HTML CSS
CSS Android
 Python
 C Programming
 C++
C++ C#
C# MongoDB
 MySQL
MySQL Javascript
 PHP
PHP
- Selected Reading
- UPSC IAS Exams Notes
- Developer's Best Practices
- Questions and Answers
- Effective Resume Writing
- HR Interview Questions
- Computer Glossary
- Who is Who
How to Set up Multiple Subplots with Group Legends using Plotly in Python
The multiple subplots are defined by assigning different graph plots. Plotly is a powerful Python library for creating interactive visualizations for data research and presentation. Its capacity to put up multiple subplots, that are independent plots placed within a single figure, is one of its primary characteristics. This feature allows us to compare and display various datasets or variables side by side, giving us a simple overview of the data. In Python, we have some built?in functions? add_trace, update_layout, and, show which can be used to set up multiple subplots with group legends using Plotly in Python.
Syntax
The following syntax is used in the examples-
add_trace()
This is a built?in method of Python following the module named plotly. It accepts the parameter as Scatter to create the new traces to figure. For example, a scatter plot may have multiple traces, each representing a different set of data points.
update_layout()
The update_layout() method is used to change the layout of a Plotly figure.
show()
The show method is used at the end of the program to get the desired figure of the graph as an output.
Algorithm of Example 1
The following steps are
Step 1: Start the program by creating the subplot data point using the module named plotly.graph_objects and take the object reference as go.
Step 2: Mention another object reference make_subplots function from the plotly.subplots module.
Step 3: Then use the object reference make_subplots that set the name of the title of each plot by using subplot_titile.
Step 4: Create the traces to set the group legend and data point.
Step 5: The figure layout has been updated using the built?in function update_layout which accepts the parameters? width, and height.
Step 6: Finally, display the result with the help show() method.
Example
In the following example, we will show the graph of two subplots that contains group legend by using the built?in method add_trace.
import plotly.graph_objects as go
from plotly.subplots import make_subplots
# Create subplots with the shared legend
fig = make_subplots(rows=2, cols=2, subplot_titles=("Plot 1", "Plot 2"))
# Add traces to subplots
fig.add_trace(go.Scatter(x=[1, 2, 3], y=[4, 5, 6], name="Trace 1"), row=1, col=1)
fig.add_trace(go.Scatter(x=[1, 2, 3], y=[14, 13, 15], name="Trace 2"), row=1, col=2)
# Update layout for legend grouping
fig.update_layout(width=800, height=600)
# Show the plot
fig.show()
Output

Example
In the following example, using make_subplots, this code generates a 2x2 grid of subplots and adds two scatter plots to the grid. The layout is altered to customize the legend grouping and display the figure.
import plotly.graph_objects as go
from plotly.subplots import make_subplots
# Create subplots with the shared legend
fig = make_subplots(rows=2, cols=2, subplot_titles=("Plot 1", "Plot 2"))
# Add traces to subplots
fig.add_trace(go.Scatter(x=[1, 2, 1, 3, 5], y=[4, 5, 2, 3, 6], name="Reliance"), row=1, col=1)
fig.add_trace(go.Scatter(x=[3, 2, 6], y=[13, 14, 15], name="TATA"), row=1, col=2)
# Update layout for customized legend grouping
fig.update_layout(width=800, height=600)
# Show the plot
fig.show()
Output

Example
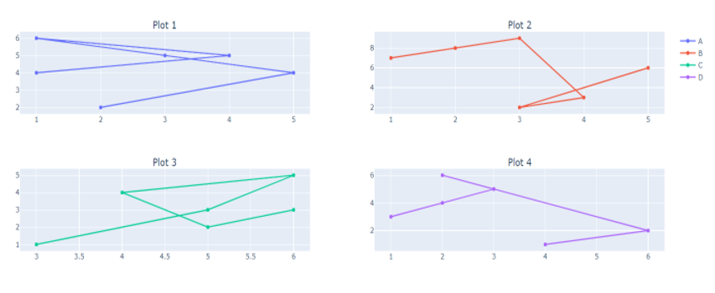
In the following example, we will show the graph of four different subplots that contains pointing data, subplot_title, and legend inside the built?in function add_trace and update_layout respectively. This will help us to build multiple subplots with legend names.
import plotly.graph_objects as go
from plotly.subplots import make_subplots
# Create subplots with the shared legend
fig = make_subplots(rows=2, cols=2, subplot_titles=("Plot 1", "Plot 2", "Plot 3", "Plot 4"))
# Add traces to subplots
fig.add_trace(go.Scatter(x=[1, 4, 1, 3, 5, 2], y=[4, 5, 6, 5, 4, 2], name="Trace 1"), row=1, col=1)
fig.add_trace(go.Scatter(x=[1, 2, 3, 4, 3, 5], y=[7, 8, 9, 3, 2, 6], name="Trace 2"), row=1, col=2)
fig.add_trace(go.Scatter(x=[3, 5, 6, 4, 5, 6], y=[1, 3, 5, 4, 2, 3], name="Trace 3"), row=2, col=1)
fig.add_trace(go.Scatter(x=[1, 2, 3, 2, 6, 4], y=[3, 4, 5, 6, 2, 1], name="Trace 4"), row=2, col=2)
# Update layout for customized legend grouping
fig.update_layout(legend=dict(tracegroupgap=70))
# Show the plot
fig.show()
Output

Conclusion
We discussed the three different ways to plot the multiple subplots with group legend using the module name Ploty. This allows us to the easy comparison data and data scientists can create detailed visualizations that improve comprehension and communication of complex datasets.

