 Data Structure
 Networking
 RDBMS
RDBMS Operating System
 Java
Java MS Excel
 iOS
iOS HTML
HTML CSS
CSS Android
 Python
 C Programming
 C++
C++ C#
C# MongoDB
 MySQL
MySQL Javascript
 PHP
PHP
- Selected Reading
- UPSC IAS Exams Notes
- Developer's Best Practices
- Questions and Answers
- Effective Resume Writing
- HR Interview Questions
- Computer Glossary
- Who is Who
Python Plotly – How to simultaneously apply color/shape/size in a Scatter Plot?
Plotly is an open-source Python library for creating interactive web-based charts. In this tutorial, we will show how you can Plotly to apply color/shape/size in a Scatter Plot.
Here, we will use the plotly.graph_objects module to generate figures. It contains a lot of method to generate charts.
In addition, we will use the add_trace() method to create a scatter plot and then use the add_shape() method to set the type, shape, and line color.
Finally, we will use the update_layout() method to set the height and width of the chart.
Follow the steps given below to apply color/shape in a scatter plot.
Step 1
Import the plotly.graphs_objs module and alias as go.
import plotly.graphs_objs as go
Step 2
Use the add_trace() method to generate the scatter plot.
# Create scatter trace of text labels
fig.add_trace(go.Scatter(
   x=[1.5, 3.5],
   y=[0.75, 2.5],
   text=["Circle", "Filled Circle"],
   mode="text",
))
Step 3
Use the update_axes() method to update the traces of the Scatter plot.
# Set axes properties
fig.update_xaxes(range=[0, 4.5], zeroline=False)
fig.update_yaxes(range=[0, 4.5])
Step 4
Use the add_shape() method to add two circle shapes on the chart.
# Add circles
fig.add_shape(type="circle", xref="x", yref="y", x0=1, y0=1, x1=3, y1=3, line_color="LightGreen", )
fig.add_shape(type="circle", xref="x", yref="y", fillcolor="pink", x0=3, y0=3, x1=4, y1=4, line_color="LightGreen",)
Step 5
Use the update_layout() method to set the height and width of the chart ?
# Set figure size
fig.update_layout(width=800, height=800)
Example
The complete code to apply color/shape/size is as follows ?
import plotly.graph_objects as go
fig = go.Figure()
# Create scatter trace of text labels
fig.add_trace(go.Scatter(
   x=[1.5, 3.5],
   y=[0.75, 2.5],
   text=["Circle", "Filled Circle"],
   mode="text",
))

# Set axes properties
fig.update_xaxes(range=[0, 4.5], zeroline=False)
fig.update_yaxes(range=[0, 4.5])

# Add circles
fig.add_shape(type="circle", xref="x", yref="y", x0=1, y0=1, x1=3, y1=3, line_color="LightGreen",)

fig.add_shape(type="circle", xref="x", yref="y",
fillcolor="pink", x0=3, y0=3, x1=4, y1=4, line_color="LightGreen", )

# Set figure size
fig.update_layout(width=716, height=400)
fig.show()
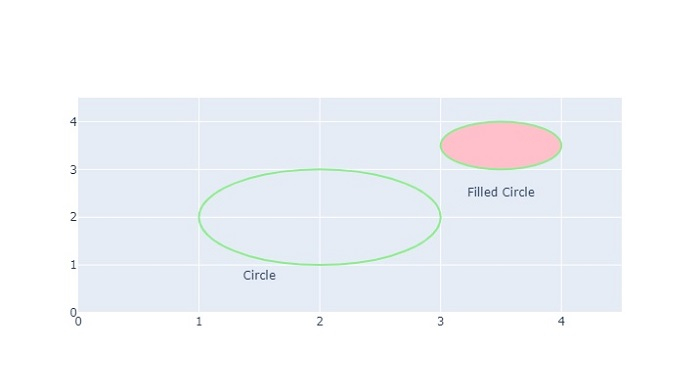
Output
On execution, it will show the following output on the browser ?

Similarly, you can try creating different types of graphs as images.

