
Article Categories
- All Categories
-
 Data Structure
-
 Networking
-
 RDBMS
RDBMS
-
 Operating System
-
 Java
Java
-
 MS Excel
-
 iOS
iOS
-
 HTML
HTML
-
 CSS
CSS
-
 Android
-
 Python
-
 C Programming
-
 C++
C++
-
 C#
C#
-
 MongoDB
-
 MySQL
MySQL
-
 Javascript
-
 PHP
PHP
-
 Economics & Finance
Selected Reading
How to create a staircase plot in R?
The simple staircase plot can be created by using geom_tile function of ggplot2 package. We just need to use the vector or the column for which we want to create the staircase plot in place of x and y as well. For example, if we have a column say x of an R data frame df then the staircase plot can be created as ggplot(df,aes(x,x))+geom_tile().
Example
Consider the below data frame:
> x<-1:10
> df<-data.frame(x)
> df
Output
x
1 1
2 2
3 3
4 4
5 5
6 6
7 7
8 8
9 9
10 10
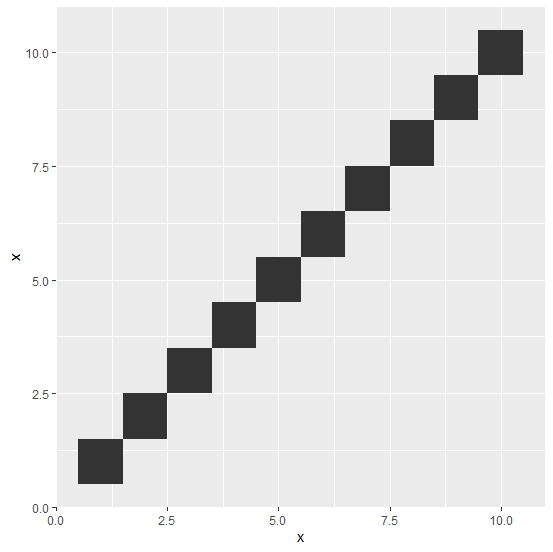
Loading ggplot2 package and creating staircase plot:
> library(ggplot2)
> ggplot(df,aes(x,x))+geom_tile()
Output
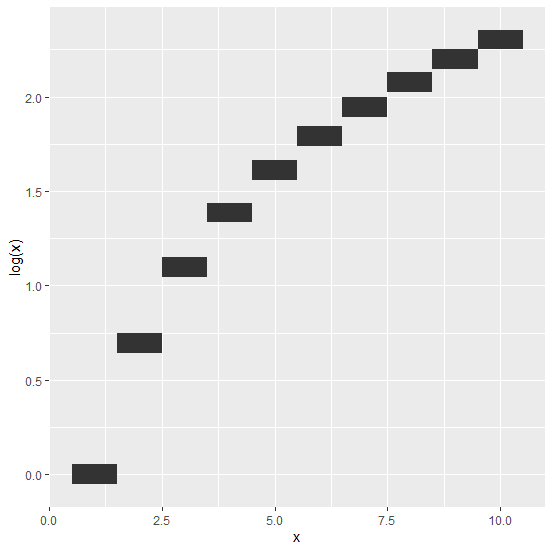
Creating a staircase plot using log function of x:
> ggplot(df,aes(x,log(x)))+geom_tile()
Output

Updated on: 2026-03-11T22:50:53+05:30
707 Views

Advertisements