
Article Categories
- All Categories
-
 Data Structure
-
 Networking
-
 RDBMS
RDBMS
-
 Operating System
-
 Java
Java
-
 MS Excel
-
 iOS
iOS
-
 HTML
HTML
-
 CSS
CSS
-
 Android
-
 Python
-
 C Programming
-
 C++
C++
-
 C#
C#
-
 MongoDB
-
 MySQL
MySQL
-
 Javascript
-
 PHP
PHP
-
 Economics & Finance
Selected Reading
How to manage top and bottom spaces of a bar plot using ggplot2 in R?
A bar plot is one of the most commonly used plots for categorical data and it can be easily done in R with the help of ggplot2. When we create a bar plot using ggplot2, there exists some space between bars and the X-axis and the largest bar and top area of the plot. This can be reduced or increased by using scale_y_continuous function.
Example
Consider the below data frame −
x <-c("X1","X2","X3","X4")
Frequency <-c(41,56,45,67)
df<-data.frame(x,Frequency)
library(ggplot2)
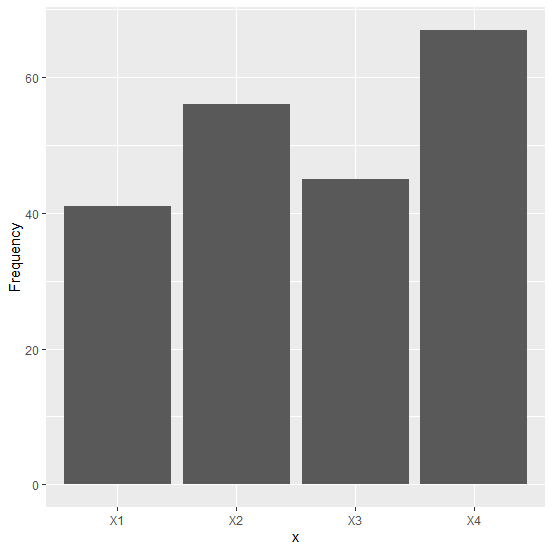
Creating a simple bar plot −
ggplot(df,aes(x,Frequency))+geom_bar(stat="identity")
Output
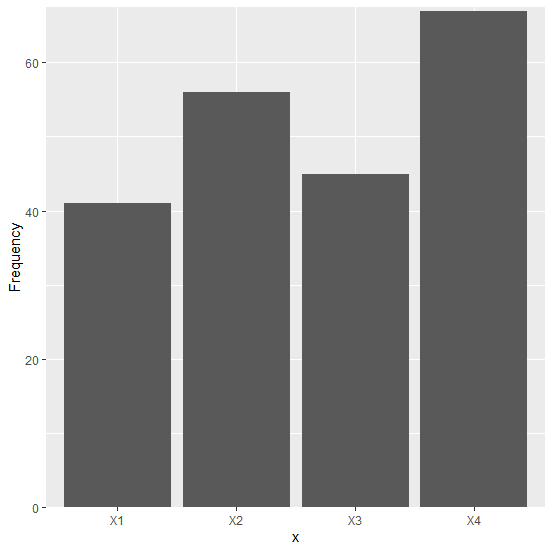
Creating a simple bar plot with zero space between bars and X-axis and a decreased top area −
Example
ggplot(df,aes(x,Frequency))+geom_bar(stat="identity")+
+ scale_y_continuous(expand=c(0,0),limits=c(0,67.5))
Output
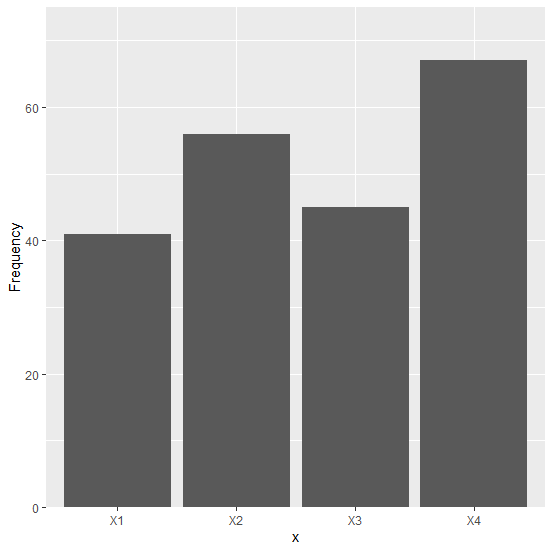
Creating a simple bar plot with zero space between bars and X-axis and an increased top area −
Example
ggplot(df,aes(x,Frequency))+geom_bar(stat="identity")+
+ scale_y_continuous(expand=c(0,0),limits=c(0,75))
Output

Updated on: 2020-08-21T11:47:07+05:30
2K+ Views

Advertisements