
Article Categories
- All Categories
-
 Data Structure
-
 Networking
-
 RDBMS
RDBMS
-
 Operating System
-
 Java
Java
-
 MS Excel
-
 iOS
iOS
-
 HTML
HTML
-
 CSS
CSS
-
 Android
-
 Python
-
 C Programming
-
 C++
C++
-
 C#
C#
-
 MongoDB
-
 MySQL
MySQL
-
 Javascript
-
 PHP
PHP
-
 Economics & Finance
Selected Reading
How to create multiple plots of different sizes in base R?
Often, we have multiple values, vectors or columns of an R data frame that needs to be plotted on a single graph so that we can compare them at the same time or they have some kind of relationship among them. Therefore, we can use layout function along with matrix function to divide the plot window as shown in the below example
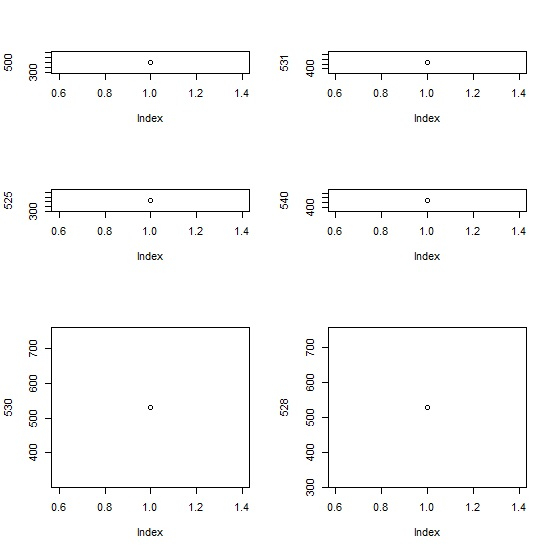
Consider the below layout and plot of individual values −
Example
layout(matrix(c(1,2,3,3,4,5,6,6),nrow=4,ncol=2,byrow=FALSE))
plot(500)
plot(525)
plot(530)
plot(531)
plot(540)
plot(528)
Output
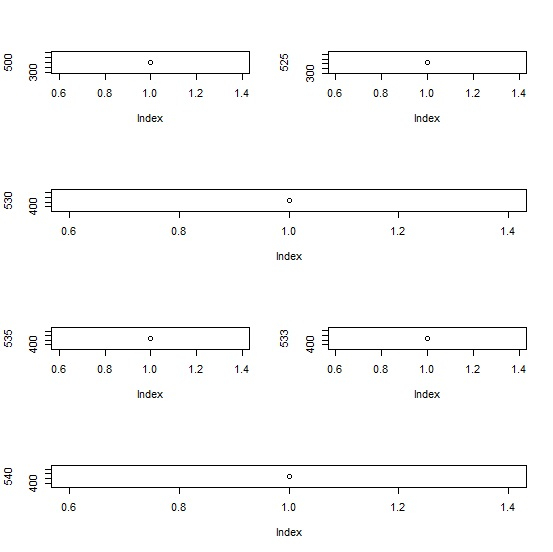
Changing the layout and creating the plots −
Example
layout(matrix(c(1,2,3,3,4,5,6,6),nrow=4,ncol=2,byrow=TRUE))
plot(500)
plot(525)
plot(530)
plot(535)
plot(533)
plot(540)
Output

Updated on: 2020-10-19T14:45:56+05:30
423 Views

Advertisements