
Article Categories
- All Categories
-
 Data Structure
-
 Networking
-
 RDBMS
RDBMS
-
 Operating System
-
 Java
Java
-
 MS Excel
-
 iOS
iOS
-
 HTML
HTML
-
 CSS
CSS
-
 Android
-
 Python
-
 C Programming
-
 C++
C++
-
 C#
C#
-
 MongoDB
-
 MySQL
MySQL
-
 Javascript
-
 PHP
PHP
-
 Economics & Finance
Selected Reading
How to stop par(mfrow) to create multiple plots in one plot window and create only one plot in R?
When we use par(mfrow), we define the number of plots we want to draw on the plot window and when we draw all the necessary plots then starts again with the first plot. For example, if we set par(mfrow) to (2,2) then we will have four plots on the plot window but if we want to create one plot on the plot window then it does not work, it will show a small plot on the upper left side. To deal with the problem, we can set par(mfrow) to (1,1).
Example
par(mfrow=c(2,2))
x<-rnorm(100)
y<-rnorm(100,0.5)
z<-rnorm(100,1)
a<-rnorm(100,1.5)
hist(x)
hist(y)
hist(z)
hist(a)
Output
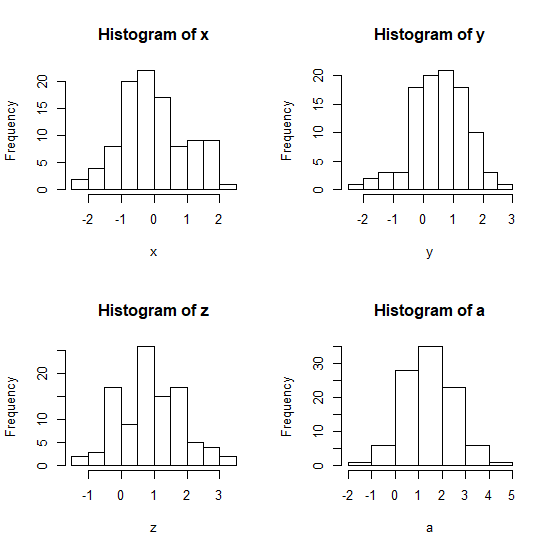
Creating fifth plot which we want to fit the whole plot window −
Example
b<-rpois(10000,2)
hist(b)
Output
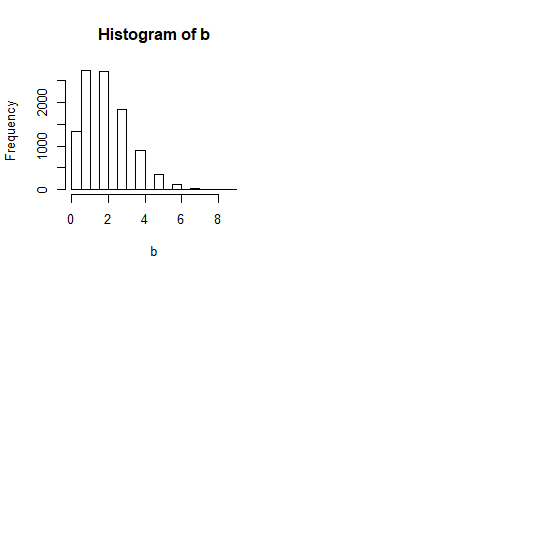
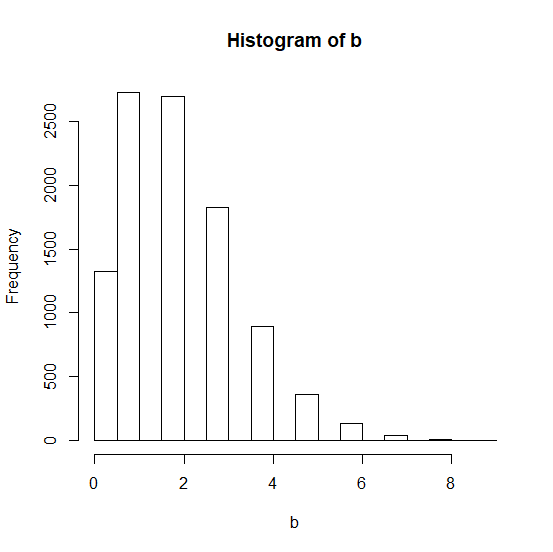
Changing par(mfrow) to make the fifth plot on the whole plot window −
Example
par(mfrow=c(1,1))
hist(b)
Output

Updated on: 2020-08-21T11:53:25+05:30
2K+ Views

Advertisements