
Article Categories
- All Categories
-
 Data Structure
-
 Networking
-
 RDBMS
RDBMS
-
 Operating System
-
 Java
Java
-
 MS Excel
-
 iOS
iOS
-
 HTML
HTML
-
 CSS
CSS
-
 Android
-
 Python
-
 C Programming
-
 C++
C++
-
 C#
C#
-
 MongoDB
-
 MySQL
MySQL
-
 Javascript
-
 PHP
PHP
-
 Economics & Finance
Selected Reading
How to create an arrow in base R?
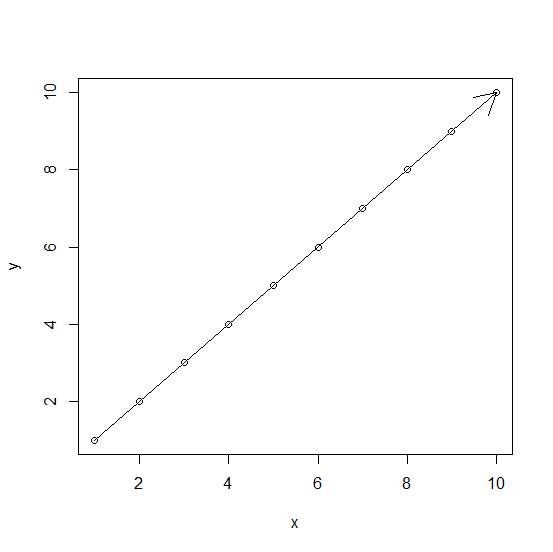
To create an arrow R, we can use plot function and arrows function. We just need to understand all the coordinate values that should be passed inside the arrows function. For example, if we have two vectors that contains values from 1 to 10 then the arrow can be created by using arrows function as arrows(1,1,10,10).
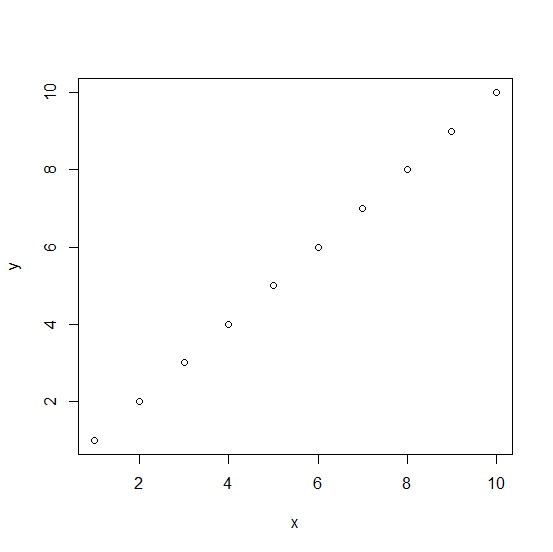
Example
> x<-1:10
> y<-1:10
> plot(x,y)
Output
Example
> arrows(1,1,10,10)
Output

Updated on: 2026-03-11T22:50:53+05:30
2K+ Views

Advertisements