
Article Categories
- All Categories
-
 Data Structure
-
 Networking
-
 RDBMS
RDBMS
-
 Operating System
-
 Java
Java
-
 MS Excel
-
 iOS
iOS
-
 HTML
HTML
-
 CSS
CSS
-
 Android
-
 Python
-
 C Programming
-
 C++
C++
-
 C#
C#
-
 MongoDB
-
 MySQL
MySQL
-
 Javascript
-
 PHP
PHP
-
 Economics & Finance
Selected Reading
How to set the plot area to assign the plots manually in base R?
We can split the screen to assign the plots manually in the plot area. The split.screen function can be used for this purpose. For example, if we want to create 4 plots in the plot window then we can use split.screen(c(2,2)). Now to create the plot in first screen the command will be screen(1) then plot will be created. If we again create the plot then the original plot in screen(1) will be replaced with the new one. To create the plot in 3rd screen that is screen(3), we first need to use the command screen(3) and then create the plot. In this way, we can assign the plots to particular places depending on the split.screen command.
Example
split.screen(c(2,2))
Output
[1] 1 2 3 4
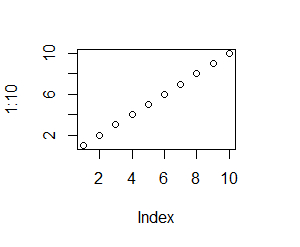
Example
screen(1)
plot(1:10)
Output
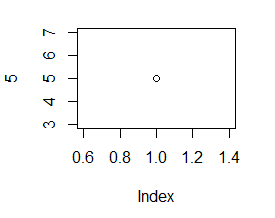
Example
plot(5)
Example
screen(4)
plot(1:5)
Output


Updated on: 2026-03-11T22:50:55+05:30
158 Views

Advertisements