
Article Categories
- All Categories
-
 Data Structure
-
 Networking
-
 RDBMS
RDBMS
-
 Operating System
-
 Java
Java
-
 MS Excel
-
 iOS
iOS
-
 HTML
HTML
-
 CSS
CSS
-
 Android
-
 Python
-
 C Programming
-
 C++
C++
-
 C#
C#
-
 MongoDB
-
 MySQL
MySQL
-
 Javascript
-
 PHP
PHP
-
 Economics & Finance
Selected Reading
How to create heatmap in base R?
A heatmap is a diagrammatic representation of data where the values are represented with colours. Mostly, it is used to display data that has slight variation and applied on matrix data. We can draw it for a full matrix, an upper triangular matrix as well as a lower triangular matrix. This can be done with the help of image function.
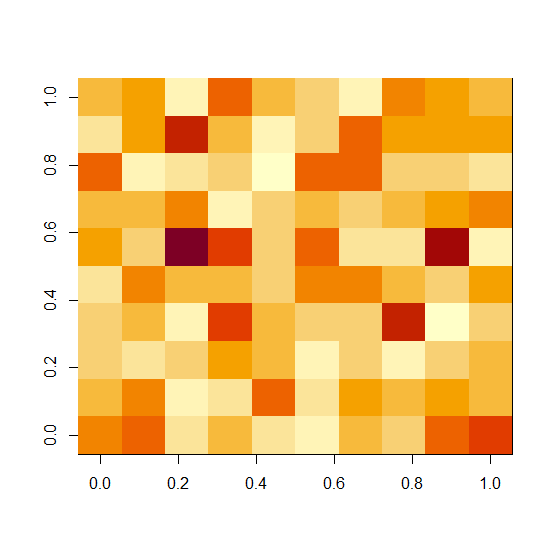
Example1
> M<-matrix(rpois(100,5),ncol=10)
> M
Output
   [,1] [,2] [,3] [,4] [,5] [,6] [,7] [,8] [,9] [,10]
[1,] 7 5 4 4 3 6 5 8 3 5
[2,] 8 7 3 5 7 4 5 2 6 6
[3,] 3 2 4 2 5 12 7 3 10 2
[4,] 5 3 6 9 5 9 2 4 5 8
[5,] 3 8 5 5 4 4 4 1 2 5
[6,] 2 3 2 4 7 8 5 8 4 4
[7,] 5 6 4 4 7 3 4 8 8 2
[8,] 4 5 2 10 5 3 5 4 6 7
[9,] 8 6 4 1 4 11 6 4 6 6
[10,] 9 5 5 4 6 2 7 3 6 5
Example
> image(M)
Output:
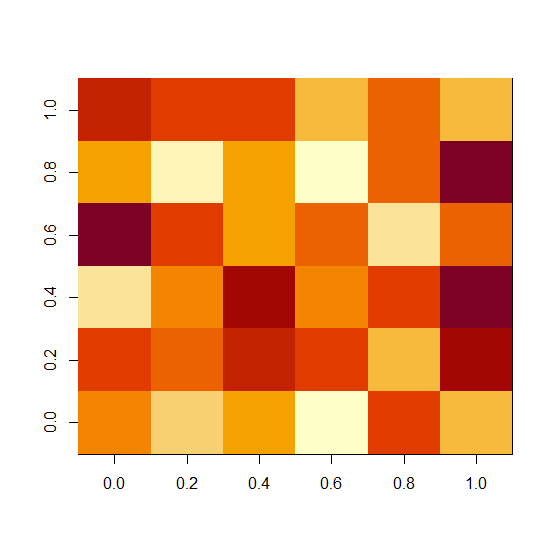
Example2
> M1<-matrix(rnorm(36,25,1),ncol=6)
> M1
Output
         [,1]      [,2]    [,3]     [,4]    [,5]    [,6]
[1,] 24.75339 25.40680 23.76650 26.47724 24.54639 25.79895
[2,] 24.08571 25.17951 25.03599 25.63532 23.45812 25.39614
[3,] 24.53005 25.77095 26.21571 24.44029 24.69933 25.62839
[4,] 22.91202 25.49497 24.86587 25.25701 23.16166 24.34106
[5,] 25.37322 24.15308 25.58580 23.52173 25.25538 25.10577
[6,] 24.39613 26.06243 26.56054 25.19265 26.54187 24.35313
Example
> image(M1)
Output:

Updated on: 2026-03-11T22:50:53+05:30
428 Views

Advertisements