
Article Categories
- All Categories
-
 Data Structure
-
 Networking
-
 RDBMS
RDBMS
-
 Operating System
-
 Java
Java
-
 MS Excel
-
 iOS
iOS
-
 HTML
HTML
-
 CSS
CSS
-
 Android
-
 Python
-
 C Programming
-
 C++
C++
-
 C#
C#
-
 MongoDB
-
 MySQL
MySQL
-
 Javascript
-
 PHP
PHP
-
 Economics & Finance
How to Create Custom Shapes of Data Points in GraphView in Android?
Custom shapes in GraphView in Android allude to the capacity to make and utilise personalised shapes for information focused on a chart. By default, graphing libraries give essential shapes like circles or squares to speak to information focus. Be that as it may, custom shapes permit designers to characterise and utilise their own one-of-a-kind shapes, such as triangles, stars, or any other craved plan. This customization improves the visual request and uniqueness of the information focus, making the chart more outwardly engaging and enlightening. Designers can make custom shapes by characterising the shape's features or by utilising picture assets. They can at that point allot these shapes to particular information focuses, giving a customised and outwardly engaging graphing involvement.
Methods Used
Manual implementation
Manual Implementation
Manual implementation within the setting of making custom shapes of information in GraphView in Android alludes to the method of physically defining and making the shapes utilising programming strategies. Rather than depending on predefined shapes given by the library, engineers can make their own special shapes by indicating the facilitates, vertices, and way of the shape. This permits total control over the shape's appearance and plan. Manual usage includes composing code to characterise the shape's properties, such as estimate, colour, and stroke. It gives adaptability and customization alternatives to tailor the information points' shapes to particular prerequisites and plan inclinations, resulting in a more personalised and outwardly engaging graphing involvement.
Algorithm
Begin the application.
Initialise the essential factors and information structures for the chart and information points.
Set up the GraphView component within the client interface to show the graph.
Create a custom Shape lesson to characterise the properties and appearance of the information point shapes.
Implement the essential strategies within the Shape lesson, such as draw(), to handle the rendering of the custom shape.
Create an array list or other reasonable information structure to store the information points.
Populate the information focus with values and relate each point to a custom-shaped object.
In the GraphView component, emphasise through the information focuses and draw each point utilising its comparing custom shape.
Implement usefulness to handle clients intuitively with the information focuses, such as press occasions or tooltips.
Test the application to guarantee the custom shapes are shown accurately and interactable.
Optimise the code for execution and memory utilisation, considering components like effective drawing procedures or caching.
Handle any potential blunders or exemptions nimbly to ensure a smooth client experience.
Finalise the application, conduct careful testing, and make any vital alterations based on client input or bug reports.
Program
Add Dependencies
The dependency `com.rati:graphview:4.2.2` is included within the Gradle construct record to incorporate the GraphView library in an Android extension. This library provides functionalities for making and showing charts in an Android application.
By including this reliance, designers gain access to the GraphView library, which rearranges the methods of chart creation, customization, and interaction. It offers different chart sorts, such as line graphs, bar charts, and diffuse plots, in conjunction with highlights like zooming, looking over, and information point highlighting. The form indicated within the reliance (`4.2.2`) guarantees compatibility with the particular highlights and bug fixes included in that discharge. It is vital to frequently check for upgrades to the library to take advantage of the most recent improvements and changes.
XML Program
<?xml version="1.0" encoding="utf-8"?>
<RelativeLayout
   xmlns:android="http://schemas.android.com/apk/res/android"
   xmlns:tools="http://schemas.android.com/tools"
   android:layout_width="match_parent"
   android:layout_height="match_parent"
   tools:context=".MainActivity">

   <com.jjoe64.graphview.GraphView
      android:id="@+id/graphview"
	  android:layout_width="match_parent"
	  android:layout_height="match_parent" />

</RelativeLayout>
Java Program
import android.graphics.Canvas;
import android.graphics.Color;
import android.graphics.Paint;
import android.os.Bundle;
import androidx.appcompat.app.AppCompatActivity;
import com.rati.graphview.GraphView;
import com.rati.graphview.series.DataPoint;
import com.rati.graphview.series.DataPointInterface;
import com.rati.graphview.series.PointsGraphSeries;
public class MainActivity extends AppCompatActivity {
GraphView graphView;
@Override
protected void onCreate(Bundle savedInstanceState) {
super.onCreate(savedInstanceState);
setContentView(R.layout.activity_main);
graphView = findViewById(R.id.graphview);
// Create PointGraphSeries with custom shape
PointsGraphSeries<DataPoint> series = new PointsGraphSeries<>(getDataPoint());
graphView.addSeries(series);
// Set properties for the series
series.setSize(50);
series.setColor(Color.RED);
// Define the custom shape for data points
series.setCustomShape(new PointsGraphSeries.CustomShape() {
@Override
public void draw(Canvas canvas, Paint paint, float x, float y, DataPointInterface dataPoint) {
paint.setStrokeWidth(5);
// Draw a custom shape using lines
canvas.drawLine(x - 20, y, x, y - 20, paint);
canvas.drawLine(x, y - 20, x + 20, y, paint);
canvas.drawLine(x + 20, y, x, y + 20, paint);
canvas.drawLine(x - 20, y, x, y + 20, paint);
}
});
}
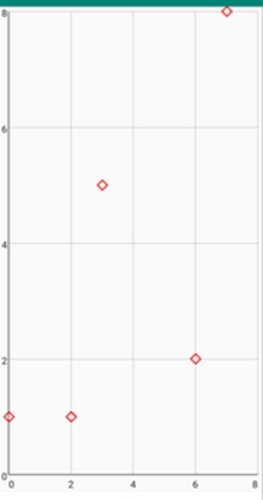
// Initialize the data points
private DataPoint[] getDataPoint() {
DataPoint[] dp = new DataPoint[]{
new DataPoint(0, 1),
new DataPoint(2, 1),
new DataPoint(3, 5),
new DataPoint(6, 2),
new DataPoint(7, 8),
};
return dp;
}
}
Output
Conclusion
This article clarifies how to make custom shapes for information focuses in GraphView on Android. It covers the concept of custom shapes and their significance in upgrading the visual appeal and uniqueness of a chart. The article talks about the manual execution approach, which includes characterising and making shapes programmatically. It gives an algorithmic diagram of the steps involved in creating custom shapes, along with a test code bit.
The article concludes by emphasising the centrality of exhaustive testing, optimisation, and blunder-taking to guarantee smooth client involvement. By and large, it guides designers in making personalised and outwardly engaging charts utilising custom shapes in GraphView.

350 Views
