
Article Categories
- All Categories
-
 Data Structure
-
 Networking
-
 RDBMS
RDBMS
-
 Operating System
-
 Java
Java
-
 MS Excel
-
 iOS
iOS
-
 HTML
HTML
-
 CSS
CSS
-
 Android
-
 Python
-
 C Programming
-
 C++
C++
-
 C#
C#
-
 MongoDB
-
 MySQL
MySQL
-
 Javascript
-
 PHP
PHP
-
 Economics & Finance
How to Create Custom Axis Labels in MATLAB
MATLAB programming has different built-in functions to customize the axis labels. In this article, we will explore the creation of custom axis labels of a plot in MATLAB.
Functions to Customize Axis Labels
MATLAB has the following built-in functions to create customized axis labels:
"xlabel()" Function - The "xlabel()" function is used to apply label for X-axis in MATLAB.
"ylabel()" Function - The "ylabel()" function is used to apply label for Y-axis in MATLAB.
"xtickangle()" Function - This function is used to rotate tick labels of X-axis.
"xtickangle()" Function - This function is used to rotate tick labels of Y-axis.
Let us now discuss the use of these MATLAB functions to format axis labels.
"xlabel()" and "ylabel()" Functions
In MATLAB, the "xlabel()" and "ylabel()" are two built-in functions used for creating custom labels for X-axis and Y-axis in a plot.
Syntax
xlable('label text');
ylable('label text');
Example
% MATLAB program to add axis labels
% Create employee presence data for 5 days
x = linspace(1, 5, 5);
y = [10 12 9 10 7];
% Plot the x and y data on graph
plot(x, y);
% Add axis labels to X-axis and Y-axis
xlabel('Work Days');
ylabel('Present Employees');
Output
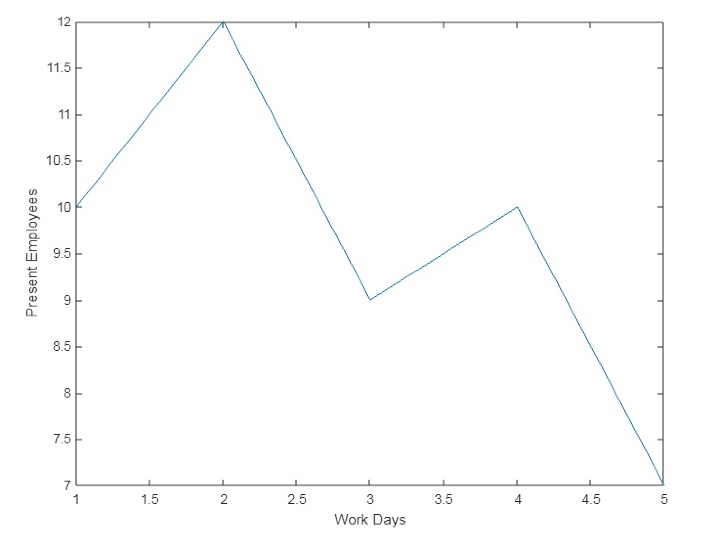
Explanation
In this MATLAB program, we started by creating sample vectors of data stored in variables "x" and "y". Then, we call the "plot" function to create a graph of data stored in "x" and "y" variables.
Finally, we use the "xlabel" and "ylabel" functions with values "Work Days" and "Present Employees" respectively to create customized axis labels.
"xtickangle()" and "ytickangle()" Functions
In MATLAB, the "xtickangle()" and "ytickangle()" are two internal functions used for rotating the tick labels of X-axis and Y-axis to a certain angle for better readability.
Syntax
xtickangle(angle_value);
ytickangle(angle_value);
The following MATLAB program demonstrates the use of "xtickangle()" and "ytickangle()" to rotate the X-axis and Y-axis tick labels.
Example
% MATLAB program to add axis labels with rotation
% Create employee presence data for 5 days
x = linspace(1, 5, 5);
y = [10 12 9 10 7];
% Plot the x and y data on graph
plot(x, y);
% Add axis labels to X-axis and Y-axis with rotating functionality
xtickangle(45);
ytickangle(90);
Output
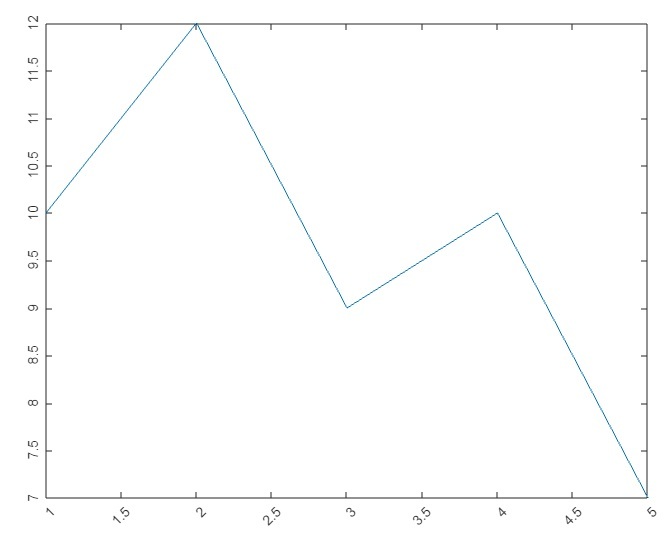
Explanation
In this MATLAB program, we started by creating sample data and store in variables "x" and "y". After that we plot a graph for these data by using the "plot" function.
Finally, we use "xtickangle(45)" and "ytickangle(90)" functions to rotate the X-axis and Y-axis tick labels by 45° and 90° respectively.
Conclusion
In conclusion, MATLAB has various internal functions that allow us to create custom label for X-axis and Y-axis in a plot. The implementation of these MATLAB functions is demonstrated in the above sections of this article with the help of example programs.

1K+ Views
