 Data Structure
 Networking
 RDBMS
RDBMS Operating System
 Java
Java MS Excel
 iOS
iOS HTML
HTML CSS
CSS Android
 Python
 C Programming
 C++
C++ C#
C# MongoDB
 MySQL
MySQL Javascript
 PHP
PHP
- Selected Reading
- UPSC IAS Exams Notes
- Developer's Best Practices
- Questions and Answers
- Effective Resume Writing
- HR Interview Questions
- Computer Glossary
- Who is Who
How to Adjust the Position of Axis Labels in Matplotlib?
When we perform data visualization in Matplotlib using subplots or plots, it is important to label the axis correctly and adjust the position of the labels of the axis if required so that they do not overlap with other elements that are there in the plot. This can help users to easily understand the data that is being presented.
For creating labels and adjusting the labels we will use the Matplotlib library which is used for creating high-quality data visualizations. This article will discuss various methods for adjusting the position of the axis labels in Matplotlib. We will be using subplots for the same.
Matplotlib
Matplotlib is a library that is mainly used for plotting graphs and plots for the Python programming language and NumPy, its extension for numerical mathematics. Tkinter, wxPython, Qt, and GTK GUI toolkits may include diagrams utilizing its object-oriented API.
The matplotlib.pyplot is a collection of command-style methods that allow matplotlib to function similarly to MATLAB. Each pyplot function alters a figure in some manner, whether it is by adding a plotting area, plotting lines, adding labels, etc. The current graph and plotting area are saved between function calls in matplotlib.pyplot, and the plotting functions are always applied to the active set of axes.
Subplots
Subplots in Matplotlib allow multiple plots or charts to be displayed within a single figure. We can compare and analyze multiple sets of data at the same time with the help of subplots. This makes spotting or identifying trends, patterns, and relationships easier.
A subplot is a grid of smaller plots that are part of a larger plot. Each subplot has its own place in the grid, which is based on the number of rows and columns in the grid and where the subplot is in that grid.
Matplotlib's "subplots" method lets us create subplots. This function returns a graph object and an array of subplot objects. We can plot our data in each subplot by using these subplot objects.
Syntax
fig,ax=plt.subplots(nrows,ncolumns,index)
Explanation
nrows ? This parameter specifies the number of rows of subplots in the grid.
ncolumns ? This parameter specifies the number of columns of subplots in the grid.
index ? This parameter specifies the index of the current subplot. The index starts at 1 and increases row-wise.
Adjust the position of axis labels
There are various methods or functions in Matplotlib using which we can adjust the position of Axis labels in Matplotlib graphs, they are ?
.set_label_coords() function
set_label_position() function
set_pad() function
.set_label_coords()
This method is used to set the coordinates of the label of the subplot.
Tick label boundary boxes determine the default values for the x coordinate of the y label and the y coordinate of the x label. The problem arises, however, when there are many axes and the labels must be aligned across them.
The coordinates of the label can be specified to the transform as well. The axes coordinate system, where (0, 0) is the bottom left corner, (0.5, 0.5) is the middle, etc., is used if None is specified.
Example 1
import matplotlib.pyplot as p
import numpy as n

# generate some data
x=n.array([11, 22,33, 44, 55,66,77,88,99,100])

# create a subplot and plot the data
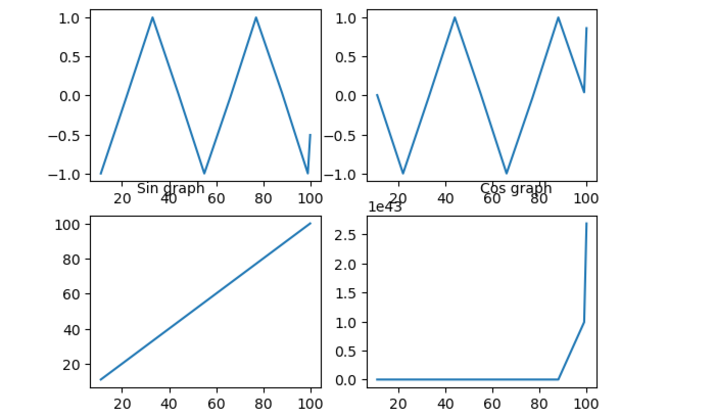
f, a = p.subplots(2,2)
a[0,0].plot(x, n.sin(x))
a[0,1].plot(x,n.cos(x))
a[1, 0].plot(x, x)
a[1, 1].plot(x, n.exp(x))
# set the x-axis label and adjust the position
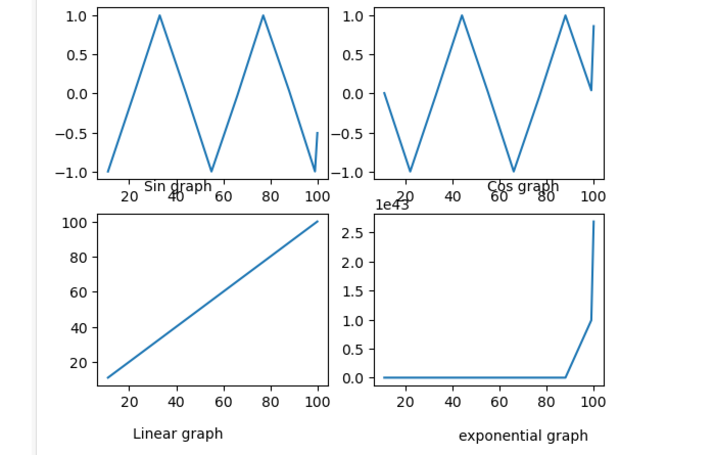
a[0,0].set_xlabel('Sin graph')
a[0,0].xaxis.set_label_coords(0.35, 0)

a[0,1].set_xlabel('Cos graph')
a[0,1].xaxis.set_label_coords(0.65,0)
a[1, 0].set_xlabel('Linear graph')
a[1,0].xaxis.set_label_coords(0.35,-0.24)
a[1, 1].set_xlabel('exponential graph')
a[1,1].xaxis.set_label_coords(0.65,-0.25)

# display the plot
p.show()
Output

set_label_position() Function
set_position() function is used to set the label position of the axis in the subplots. This method accepts the following parameters ?
Position ? ?left',' right',' top',' bottom'.
Example 2
import matplotlib.pyplot as p
import numpy as n

# generate some data
x=n.array([11, 22,33, 44, 55,66,77,88,99,100])

# create a subplot and plot the data
f, a = p.subplots(2,2)
a[0,0].plot(x, n.sin(x))
a[0,1].plot(x,n.cos(x))
a[1, 0].plot(x, x)
a[1, 1].plot(x, n.exp(x))
# set the x-axis label and y label and adjust the position
a[0,0].set_xlabel('Sin graph')
a[0,0].xaxis.set_label_position('bottom')
a[0,0].yaxis.set_label_position('left')
a[0,0].xaxis.set_label_coords(0.35, 0)
a[0,0].yaxis.set_label_coords(0.35, 0)
a[0,1].set_xlabel('Cos graph')
a[0,1].xaxis.set_label_position('bottom')
a[0,0].yaxis.set_label_position('left')
a[0,1].xaxis.set_label_coords(0.65,0)
a[0,1].yaxis.set_label_coords(0.65,0)
a[1, 0].set_xlabel('Linear graph')
a[1,0].xaxis.set_label_position('bottom')
a[0,0].yaxis.set_label_position('left')
a[1,0].xaxis.set_label_coords(0.35,-0.24)
a[1,0].yaxis.set_label_coords(0.35,-0.24)
a[1, 1].set_xlabel('exponential graph')
a[1,1].xaxis.set_label_position('bottom')
a[0,0].yaxis.set_label_position('left')
a[1,1].xaxis.set_label_coords(0.65,-0.25)
a[1,1].yaxis.set_label_coords(0.65,-0.25)


# display the plot
p.show()
Output

set_pad(), labelpad parameter of the set_label function
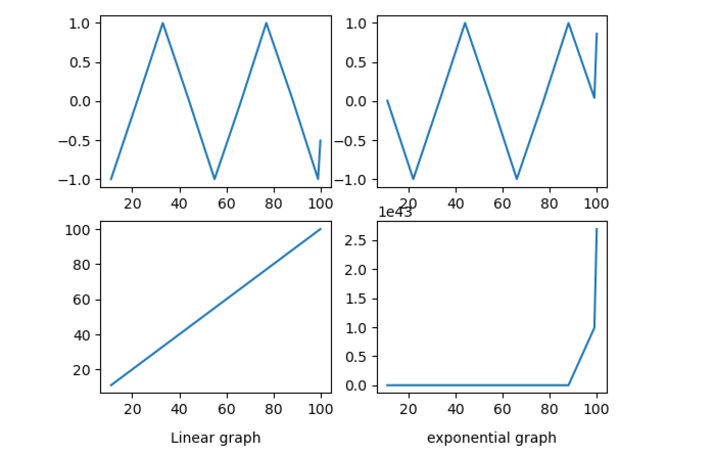
With the set pad() function, we can change how far apart the axis label and the axis tick labels are.
For example, we can use the following code to change how much space is around the x-axis label in a subplot ?
Example 3
import matplotlib.pyplot as plt
import numpy as np

# generate some data
x=np.array([11, 22,33, 44, 55,66,77,88,99,100])

# create a subplot and plot the data
fig, ax = plt.subplots(2,2)
ax[0,0].plot(x, np.sin(x))
ax[0,1].plot(x,np.cos(x))
ax[1, 0].plot(x, x)
ax[1, 1].plot(x, np.exp(x))
# set the x-axis label and adjust the position

ax[1, 0].set_xlabel('Linear graph',labelpad=10)

ax[1, 1].set_xlabel('exponential graph',labelpad=10)


# display the plot
plt.show()
Output

Conclusion
In conclusion, adjusting the position of axis labels is an important part of using Matplotlib to make plots that are clear and accurate. Set_label_coords(), set_position(), and set_pad() are some of the methods we can use to change the position of axis labels in a plot or subplot.

