
Article Categories
- All Categories
-
 Data Structure
-
 Networking
-
 RDBMS
RDBMS
-
 Operating System
-
 Java
Java
-
 MS Excel
-
 iOS
iOS
-
 HTML
HTML
-
 CSS
CSS
-
 Android
-
 Python
-
 C Programming
-
 C++
C++
-
 C#
C#
-
 MongoDB
-
 MySQL
MySQL
-
 Javascript
-
 PHP
PHP
-
 Economics & Finance
How to Create Logarithmic Scales in MATLAB
MATLAB has three built-in functions "semilogx", "semilogy", and "loglog" to covert the linear axis scales to logarithmic scales in a plot.
Here, the "semilogx()" function is used to change the X-axis scale to a logarithmic scale. The "semilogy()" function is used to change the Y-axis scale to a logarithmic scale. The "loglog()" functions changes both X-axis and Y-axis scales to logarithmic scales.
Syntax
semilogx(x, y);
semilogy(x, y);
loglog(x, y);
The following MATLAB program demonstrates the use of "semilogx()", "semilogy()", and "loglog()" functions to change the axis scales to logarithmic scales in MATLAB.
Example
% MATLAB program to change axis scales to logarithmic scale
% Create sample data vectors
x = linspace(1, 10, 10);
y = x.^3;
% Plot the data using various logarithmic scales
figure;
% Changing X-axis scale to logarithmic using semilogx function
subplot(1, 3, 1);
semilogx(x, y);
xlabel('x-axis (semilogx)');
ylabel('y-axis');
title('Semilogx Plot');
% Changing Y-axis scale to logarithmic using semilogy function
subplot(1, 3, 2);
semilogy(x, y);
xlabel('x-axis');
ylabel('y-axis (semilogy)');
title('Semilogy Plot');
% Changing both X-axis and Y-axis scales to logarithmic using loglog function
subplot(1, 3, 3);
loglog(x, y);
xlabel('x-axis (loglog)');
ylabel('y-axis (loglog)');
title('Loglog Plot');
% Adjust subplot spacing with a title
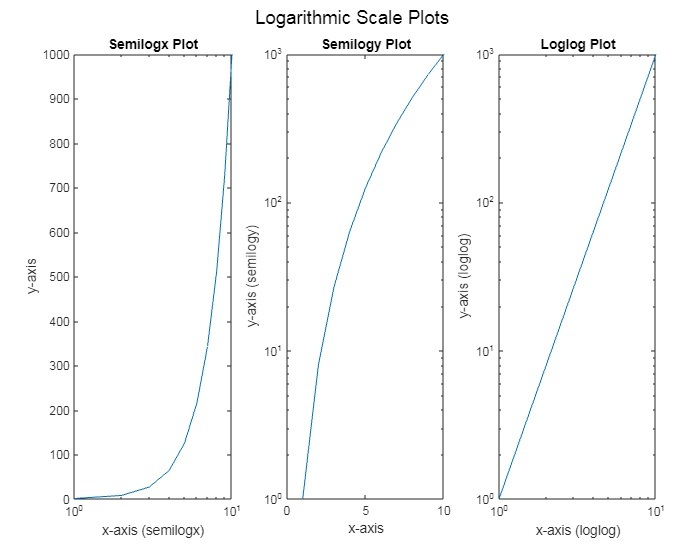
sgtitle('Logarithmic Scale Plots');
Output
Conclusion
In the above MATLAB program, we start by creating sample data vector "x". Then, we calculate cube of values of "x" and store them in another vector "y". Next, we start plotting the graphs for the values of x and y. Also, we specify the functions "semilogx()", "semilogy()", and "loglog()" to change the axis scales to log scale as described below.
In the first subplot, we change X-axis scale to a logarithmic scale by using the "semilogx" function.
In the second subplot, we change the Y-axis scale to a logarithmic scale by using the "semilogy" function.
In the third subplot, we change both X-axis and Y-axis scales to a logarithmic scales by using the "loglog" function.
Finally, we call MATLAB's "sgtitle" function to display a main title "Logarithmic Scale Plots" to the plot figure.
This is how we can convert the linear axis scales to the logarithmic scales in MATLAB.

2K+ Views
