 Data Structure
 Networking
 RDBMS
RDBMS Operating System
 Java
Java MS Excel
 iOS
iOS HTML
HTML CSS
CSS Android
 Python
 C Programming
 C++
C++ C#
C# MongoDB
 MySQL
MySQL Javascript
 PHP
PHP
- Selected Reading
- UPSC IAS Exams Notes
- Developer's Best Practices
- Questions and Answers
- Effective Resume Writing
- HR Interview Questions
- Computer Glossary
- Who is Who
How to Hide Axis Text Ticks or Tick Labels in Matplotlib?
Introduction
Matplotlib is a powerful data visualization library in Python that provides a wide range of options for creating plots and charts. One common requirement when creating visualizations is the ability to hide the axis text ticks or tick labels. This article will explore different approaches to achieve this in Matplotlib, along with code examples for each approach.
Syntax
The syntax for hiding axis text ticks or tick labels in Matplotlib is as follows ?
ax.set_xticks([])
ax.set_yticks([])
Algorithm
The algorithm to hide axis text ticks or tick labels in Matplotlib can be summarized in the following steps ?
Import the fundamental libraries ? Begin by bringing in the expected libraries, including Matplotlib.
Make a plot ? Set up a figure and make a plot utilizing Matplotlib.
Conceal the hub text ticks or tick names ? Utilize the set_xticks([]) and set_yticks([]) techniques to conceal the ticks or tick marks on the x-hub and y-hub, respectively.
Show the plot ? Show the plot utilizing the plt.show() capability.
Approach 1: Hide All Axis Text Ticks or Tick Labels
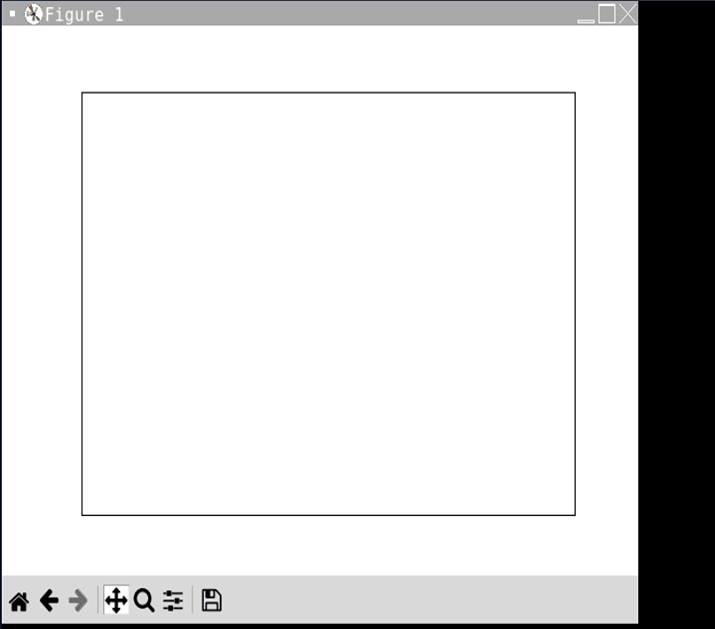
The first approach involves hiding all the axis text ticks or tick labels. This can be useful when you want to focus solely on the plot without any distractions from the axis markings.
Example
import matplotlib.pyplot as plt

# Create a plot
fig, ax = plt.subplots()

# Plot your data

# Hide all axis text ticks or tick labels
ax.set_xticks([])
ax.set_yticks([])

# Show the plot
plt.show()
Output

Explanation
Hide All Axis Text Ticks or Tick Labels
The first approach involves hiding all the axis text ticks or tick labels in Matplotlib. This approach is useful when you want to focus solely on the plot itself without any distractions from the axis markings. By hiding all the ticks and labels, you can create a cleaner and less cluttered visualization.
To implement this approach, start by importing the necessary libraries, including Matplotlib. Then, create a plot by setting up a figure and axes using Matplotlib's subplots() function.
Once you have your plot ready, you can hide all the axis text ticks or tick labels by using the set_xticks([]) and set_yticks([]) methods on the ax object. By passing an empty list as an argument to these methods, you effectively remove all the ticks or labels from the respective axis. This leaves you with a plot that only displays the data and the axes lines.
Finally, you can display the plot using the plt.show() function.
Approach 2: Hide Specific Axis Text Ticks or Tick Labels
The second approach allows you to hide specific axis text ticks or tick labels while keeping others visible. This can be useful when you want to selectively hide certain ticks or labels to improve the clarity of your visualization.
Example
import matplotlib.pyplot as plt

# Create a plot
fig, ax = plt.subplots()

# Plot your data

# Hide specific axis text ticks or tick labels
ax.set_xticks([0, 2, 4])
ax.set_xticklabels([])

ax.set_yticks([0, 10, 20])
ax.set_yticklabels([])

# Show the plot
plt.show()
Output

Explanation
Hide Specific Axis Text Ticks or Tick Labels
The second approach allows you to selectively hide specific axis text ticks or tick labels while keeping others visible. This approach is helpful when you need to work on the clearness of your perception by eliminating specific ticks or labels that may not be important or may cause visual mess.
To carry out this methodology, begin by bringing in the fundamental libraries, including Matplotlib. Make a plot by setting up a figure and axes utilizing Matplotlib's subplots() capability, like the past methodology.
Once you have your plot ready, you can hide specific axis text ticks or tick labels by using the set_xticks() and set_yticks() methods on the ax object. By passing a rundown of the particular ticks you need to hold as a contention to these techniques, you really hold those ticks while eliminating the rest. To conceal the relating tick labels, you can utilize the set_xticklabels([]) and set_yticklabels([]) techniques, passing an empty list as an argument.
By selectively hiding ticks or labels, you can emphasize certain values or intervals in your plot while reducing visual clutter. This approach gives you more control over the appearance of your visualization.
Finally, display the plot using the plt.show() function.
In conclusion, both approaches provide flexibility in hiding axis text ticks or tick labels in Matplotlib. The first approach allows you to hide all the ticks and labels, providing a clean and focused visualization. The second approach enables you to selectively hide specific ticks or labels to enhance the clarity and emphasize certain aspects of your plot. Depending on your data and visualization goals, you can choose the approach that best your requirements and needs.
Conclusion
In this article, we explored different approaches to hide axis text ticks or tick labels in Matplotlib. We learned how to hide all axis text ticks or tick labels using the set_xticks([]) and set_yticks([]) methods, as well as how to hide specific ticks or labels by selectively specifying the ticks to hide. These techniques can be valuable in creating clean and focused visualizations that highlight the main elements of your data. With the knowledge gained from this article, you can now effectively control the visibility of axis text ticks or tick labels in Matplotlib to enhance your data visualizations.

