
Article Categories
- All Categories
-
 Data Structure
-
 Networking
-
 RDBMS
RDBMS
-
 Operating System
-
 Java
Java
-
 MS Excel
-
 iOS
iOS
-
 HTML
HTML
-
 CSS
CSS
-
 Android
-
 Python
-
 C Programming
-
 C++
C++
-
 C#
C#
-
 MongoDB
-
 MySQL
MySQL
-
 Javascript
-
 PHP
PHP
-
 Economics & Finance
How to Set Axis Tick values in MATLAB?
To apply custom axis tick values, MATLAB has two built-in functions "xticks()" and "yticks()". Here, the "xticks()" function is used for customizing the tick values of X-axis in a MATLAB plot, while the "yticks()" function is used for setting custom tick values to Y-axis.
Syntax
xticks([custom_tick_values]);
yticks([custom_tick_values]);
The following MATLAB program demonstrate the use of "xticks()" and "yticks()" functions to create custom tick values for X-axis and Y-axis.
Example
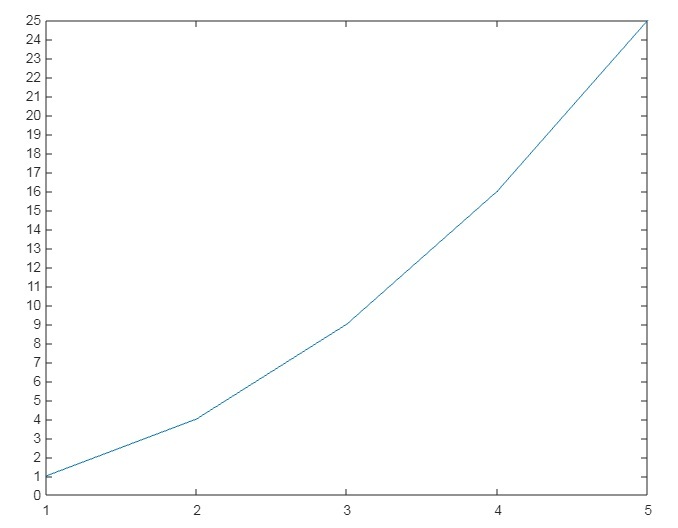
% MATLAB program to specify custom axis tick values
% Create a sample vector of data
x = linspace(1, 5, 5);
y = x.^2;
% Plot the x and y data on graph
plot(x, y);
% Specify the custom tick values of the X and Y axes
xticks(1:5);
yticks(0:25);
Conclusion
In this MATLAB program, we start by creating a sample vector of data and store it in a variable "x". Then, we compute square of the values of vector "x" and store in another variable "y". After that we plot the graph of x and y by using MATLAB's "plot()" function.
Finally, we use "xticks(1:5)" to set custom X-axis tick values from 1 to 5 and the "yticks(0:25)" function to set custom Y-axis tick values from 0 to 25.
This is how we can set custom tick values to axes in MATLAB.

806 Views
