
Article Categories
- All Categories
-
 Data Structure
-
 Networking
-
 RDBMS
RDBMS
-
 Operating System
-
 Java
Java
-
 MS Excel
-
 iOS
iOS
-
 HTML
HTML
-
 CSS
CSS
-
 Android
-
 Python
-
 C Programming
-
 C++
C++
-
 C#
C#
-
 MongoDB
-
 MySQL
MySQL
-
 Javascript
-
 PHP
PHP
-
 Economics & Finance
Selected Reading
How to create a rectangle inside boxplot in base R?
To create a rectangle inside boxplot in base R, we can use rect function after creating the boxplot. The rect function has many arguments but for the creation of a rectangle only first four are necessary and these are defined as xleft - a vector (or scalar) of left x positions, ybottom - a vector (or scalar) of bottom y positions, xright - a vector (or scalar) of right x positions and ytop - a vector (or scalar) of top y positions.
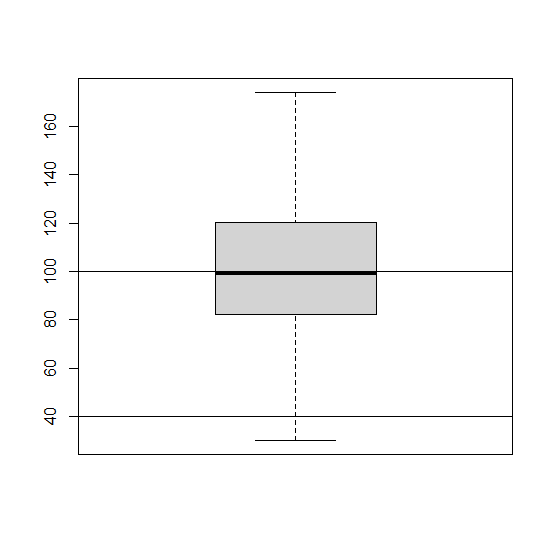
Example
x<-rnorm(200,100,25)
boxplot(x)
rect(0,40,50,100)
Output
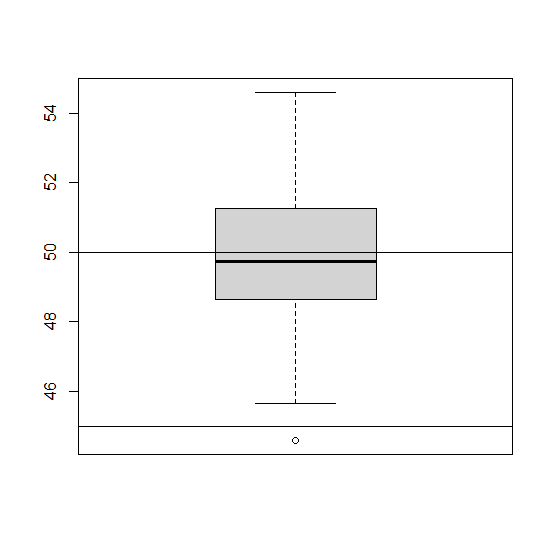
Example
y<-rnorm(100,50,2)
boxplot(y)
rect(0,45,50,50)
Output

Updated on: 2026-03-11T22:50:54+05:30
343 Views

Advertisements