
Article Categories
- All Categories
-
 Data Structure
-
 Networking
-
 RDBMS
RDBMS
-
 Operating System
-
 Java
Java
-
 MS Excel
-
 iOS
iOS
-
 HTML
HTML
-
 CSS
CSS
-
 Android
-
 Python
-
 C Programming
-
 C++
C++
-
 C#
C#
-
 MongoDB
-
 MySQL
MySQL
-
 Javascript
-
 PHP
PHP
-
 Economics & Finance
Selected Reading
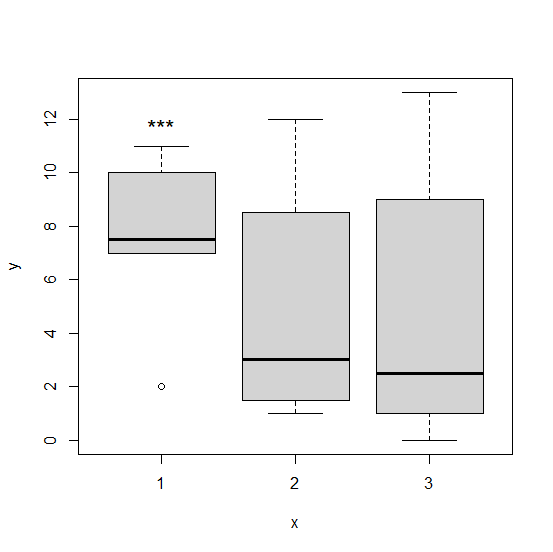
How to display star for significance in base R boxplot?
To display the star for significance in a base R boxplot, we can use text function. The text function will be helpful in defining the star sign (that is asterisk or *). If the significance is high then three stars are used and the significance is low then a single star is used. We need to use the appropriate position using x and y values.
Example
text(x=1,y=max(df$y[df$x==1]),"***",pos=3,cex=1.5)
Output

Updated on: 2026-03-11T23:22:53+05:30
4K+ Views

Advertisements