
Article Categories
- All Categories
-
 Data Structure
-
 Networking
-
 RDBMS
RDBMS
-
 Operating System
-
 Java
Java
-
 MS Excel
-
 iOS
iOS
-
 HTML
HTML
-
 CSS
CSS
-
 Android
-
 Python
-
 C Programming
-
 C++
C++
-
 C#
C#
-
 MongoDB
-
 MySQL
MySQL
-
 Javascript
-
 PHP
PHP
-
 Economics & Finance
Selected Reading
How to make a plot title partially bold using ggplot2 in R?
To make a plot title partially bold using ggplot2, we can use bquote function inside labs function and then changing the default font to bold using bold function as shown in the below examples. While using these functions we need to make sure that the title that we want to bold should be inside circular brackets appropriately.
Example
Consider the below data frame −
> x<-rnorm(20)
> y<-rnorm(20)
> df<-data.frame(x,y)
> df
Output
             x           y
1  -0.62160328  0.38477515
2   0.68287365 -1.56169067
3   0.75259774  1.28849990
4   0.56688920 -0.17014225
5   1.22351113 -0.32446764
6  -1.54210099  0.29001967
7   0.08800284  1.34342269
8   1.77498480 -0.75239348
9  -0.31916824  0.24433868
10  0.09802049 -0.91107863
11 -1.63060088  0.05336120
12  0.01328284 -2.36494891
13 -1.69921881 -1.29001305
14 -0.02819300 -0.06126524
15  0.77405426  0.25468262
16 -0.36423968  0.79130216
17  0.26224330  0.10437648
18  0.31894879 -0.50317250
19  0.37739488  0.62952910
20  0.26141716 -0.97143860
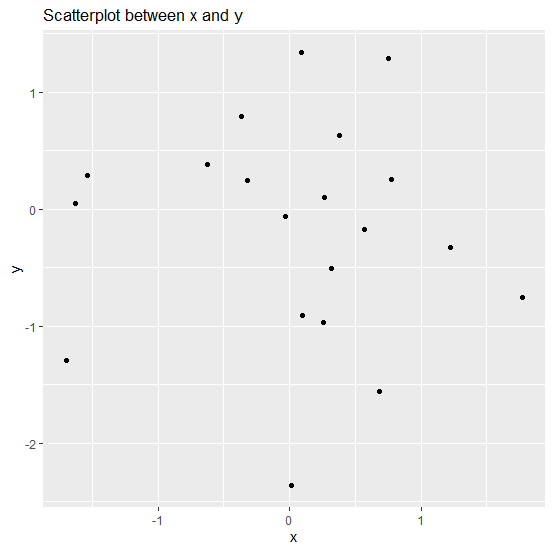
Loading ggplot2 package and creating scatterplot with plot title −
> library(ggplot2)
> ggplot(df,aes(x,y))+geom_point()+labs(title="Scatterplot between x and y")
Output
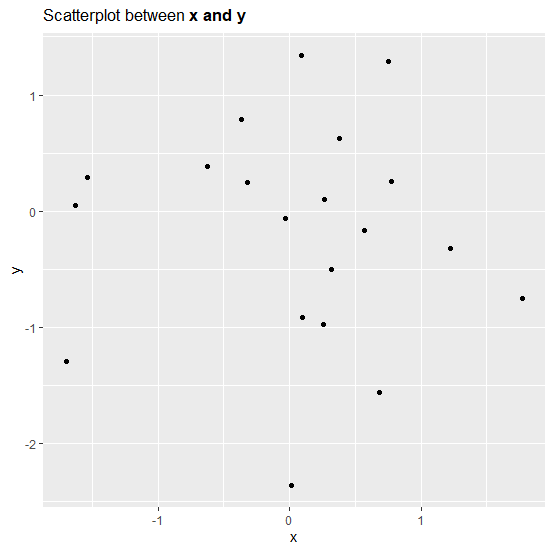
Creating scatterplot with plot title partially in bold −
> ggplot(df,aes(x,y))+geom_point()+labs(title=bquote("Scatterplot between"~bold("x and y")))
Output

Updated on: 2026-03-11T22:50:56+05:30
4K+ Views

Advertisements