
Article Categories
- All Categories
-
 Data Structure
-
 Networking
-
 RDBMS
RDBMS
-
 Operating System
-
 Java
Java
-
 MS Excel
-
 iOS
iOS
-
 HTML
HTML
-
 CSS
CSS
-
 Android
-
 Python
-
 C Programming
-
 C++
C++
-
 C#
C#
-
 MongoDB
-
 MySQL
MySQL
-
 Javascript
-
 PHP
PHP
-
 Economics & Finance
Selected Reading
How to check the difference between plot generation time in base R?
One of the mostly used time measurement function in R is microbenchmark function of microbenchmark package. We can pass the function to create the plot inside microbenchmark function and this will result in the processing time for each of the plots then a comparison can be done for the difference.
Example1
Loading microbenchmark package:
> library(microbenchmark)
Finding the plot generation time:
> x1 x2 x3 X X
Unit: milliseconds
   expr      min    lq       mean     median uq       max  neval
plot(x1) 12.7488 14.88815 15.65040 15.2515 15.90765 23.9348  100
plot(x2) 20.9810 21.67780 23.92976 22.2116 23.29665 137.2474 100
plot(x3) 93.6965 95.03440 96.67086 95.6717 97.12290 125.3670 100
Plots:
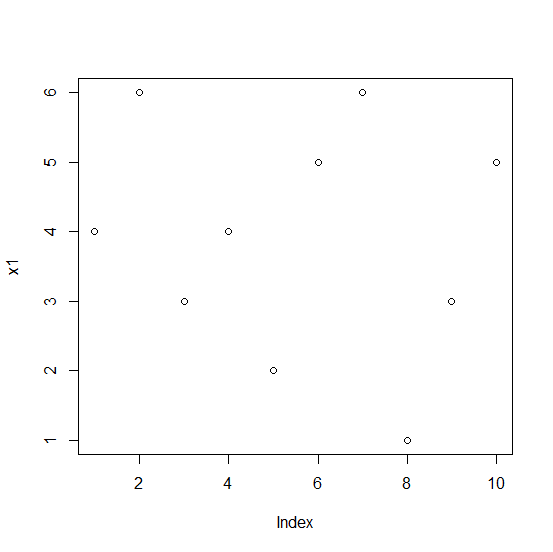
Example
> plot(x1)
Output:
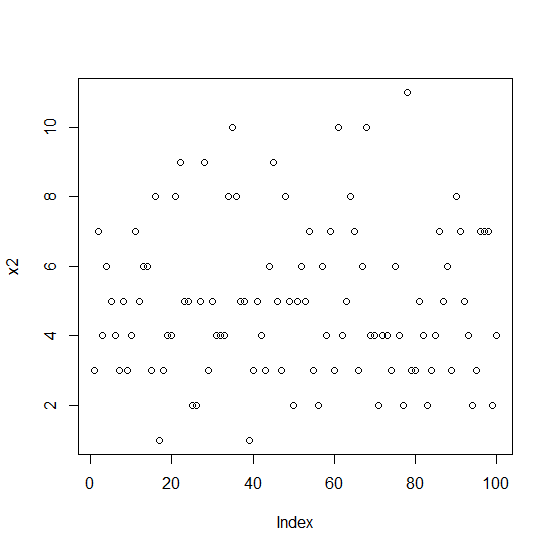
Example
> plot(x2)
Output:
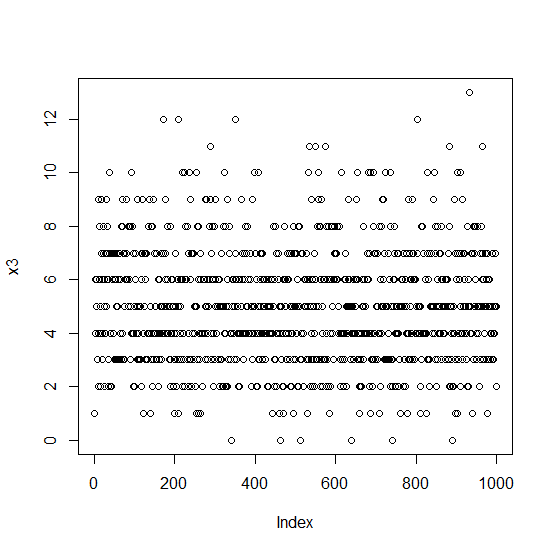
Example
> plot(x3)
Output:

Updated on: 2020-11-06T11:28:33+05:30
140 Views

Advertisements