
Article Categories
- All Categories
-
 Data Structure
-
 Networking
-
 RDBMS
RDBMS
-
 Operating System
-
 Java
Java
-
 MS Excel
-
 iOS
iOS
-
 HTML
HTML
-
 CSS
CSS
-
 Android
-
 Python
-
 C Programming
-
 C++
C++
-
 C#
C#
-
 MongoDB
-
 MySQL
MySQL
-
 Javascript
-
 PHP
PHP
-
 Economics & Finance
How to create a vertical line in a time series plot in base R?
To create a time series plot, we can use simply apply plot function on time series object and if we want to create a vertical line on that plot then abline function will be used with v argument.
For example, if we have a time series object called T and we want to create a time series plot of T with vertical line at point 5 then we can use the below given command after creating the plot −
abline(v=5)
Example
To create a vertical line in a time series plot in base R, use the following code −
x<-ts(rpois(10,5))
x
Time Series:
Start = 1
End = 10
Frequency = 1
If you execute the above given code, it generates the following output −
[1] 3 8 5 8 6 4 3 2 5 7
To create a vertical line in a time series plot in base R, add the following code to the above code −
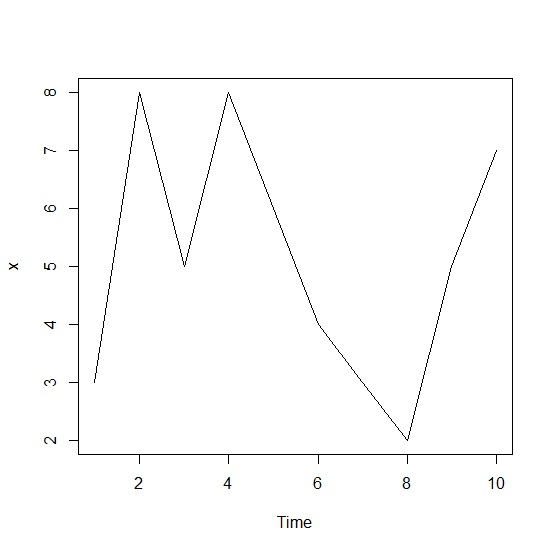
x<-ts(rpois(10,5))
plot(x)
Output
If you execute all the above given codes as a single program, it generates the following output −
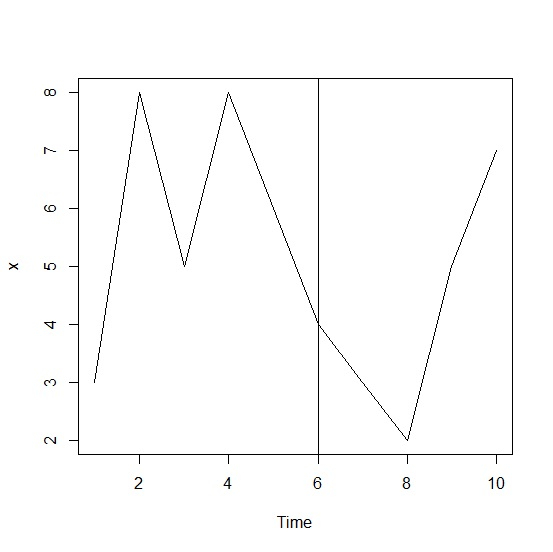
To create a vertical line in a time series plot in base R, add the following code to the above code −
x<-ts(rpois(10,5))
plot(x)
abline(v=6)
Output
If you execute all the above given codes as a single program, it generates the following output −

1K+ Views
