
Article Categories
- All Categories
-
 Data Structure
-
 Networking
-
 RDBMS
RDBMS
-
 Operating System
-
 Java
Java
-
 MS Excel
-
 iOS
iOS
-
 HTML
HTML
-
 CSS
CSS
-
 Android
-
 Python
-
 C Programming
-
 C++
C++
-
 C#
C#
-
 MongoDB
-
 MySQL
MySQL
-
 Javascript
-
 PHP
PHP
-
 Economics & Finance
Selected Reading
How to create a perpendicular arrow in base R plot?
To create a perpendicular arrow in base R plot, we can use arrows function. There are five arguments of arrows function that will be used to create the perpendicular arrow. The first four values define the position of the arrow and the last argument xpd allows R to create the arrow. Check out the below examples to understand how it works.
Example
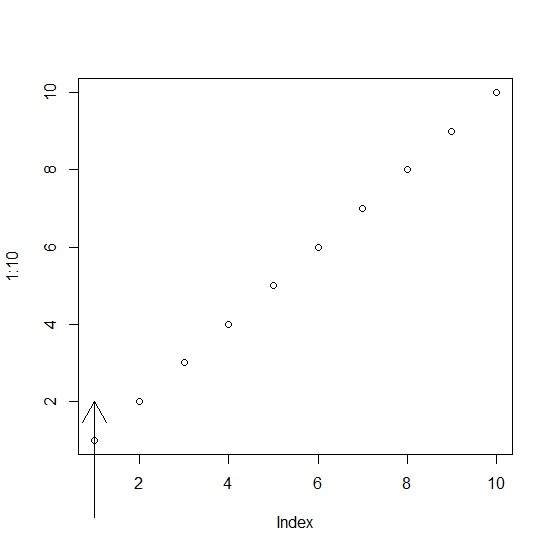
plot(1:10)
arrows(1,-1,1,0,xpd=TRUE)
Output
![]()
Example
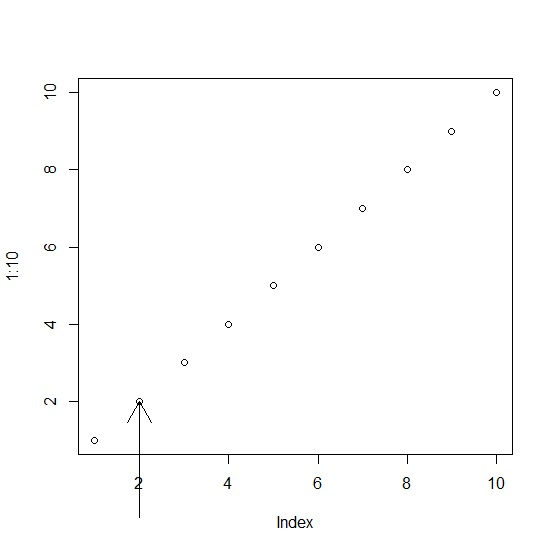
plot(1:10)
arrows(1,-1,1,2,xpd=TRUE)
Output
Example
plot(1:10)
arrows(2,-1,2,2,xpd=TRUE)
Output

Updated on: 2021-02-06T11:29:48+05:30
299 Views

Advertisements