
Article Categories
- All Categories
-
 Data Structure
-
 Networking
-
 RDBMS
RDBMS
-
 Operating System
-
 Java
Java
-
 MS Excel
-
 iOS
iOS
-
 HTML
HTML
-
 CSS
CSS
-
 Android
-
 Python
-
 C Programming
-
 C++
C++
-
 C#
C#
-
 MongoDB
-
 MySQL
MySQL
-
 Javascript
-
 PHP
PHP
-
 Economics & Finance
Selected Reading
How to display infinity symbol in base R plot?
To display infinity symbol in base R plot, we can use text function and expression function. Inside expression function we can put infinity word for the display of infinity. For Example, if we want to display infinity at position X=2 and Y=4 then we can use the below mentioned command −
text(2,4,expression(infinity))
Example 1
To display infinity symbol in base R plot, use the snippet given below −
plot(1:10,type="n")
text(5,5,expression(infinity))
Output
If you execute the above given snippet, it generates the following Output −

Example 2
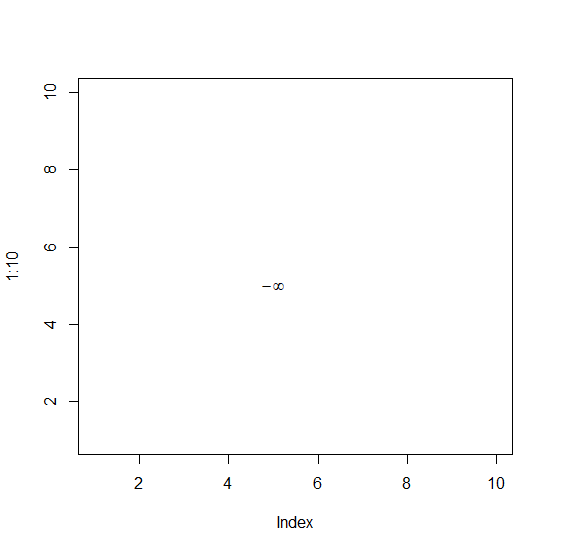
To display infinity symbol in base R plot, use the snippet given below −
plot(1:10,type="n")
text(5,5,expression(-infinity))
Output
If you execute the above given snippet, it generates the following Output −

Updated on: 2021-11-08T08:15:09+05:30
1K+ Views

Advertisements