
Article Categories
- All Categories
-
 Data Structure
-
 Networking
-
 RDBMS
RDBMS
-
 Operating System
-
 Java
Java
-
 MS Excel
-
 iOS
iOS
-
 HTML
HTML
-
 CSS
CSS
-
 Android
-
 Python
-
 C Programming
-
 C++
C++
-
 C#
C#
-
 MongoDB
-
 MySQL
MySQL
-
 Javascript
-
 PHP
PHP
-
 Economics & Finance
Selected Reading
How to change the resolution of a plot in base R?
In base R, we can save a plot as a png and pass the resolution in the same stage. The procedure to do this is creating the png image with resolution with res argument then creating the plot and using dev.off() to create the file. Check out the below examples to understand how it works.
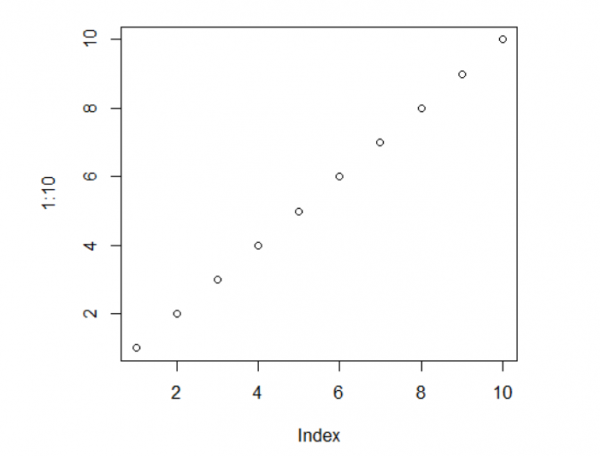
Example1
> png(file="example1.png",res=100)
> plot(1:10)
> dev.off()
Output:
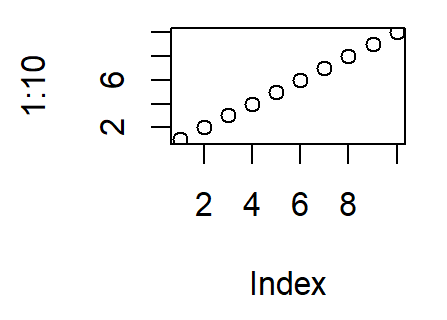
Example2
> png(file="example2.png",res=200)
> plot(1:10)
> dev.off()
Output

Updated on: 2026-03-11T22:50:53+05:30
3K+ Views

Advertisements