
Article Categories
- All Categories
-
 Data Structure
-
 Networking
-
 RDBMS
RDBMS
-
 Operating System
-
 Java
Java
-
 MS Excel
-
 iOS
iOS
-
 HTML
HTML
-
 CSS
CSS
-
 Android
-
 Python
-
 C Programming
-
 C++
C++
-
 C#
C#
-
 MongoDB
-
 MySQL
MySQL
-
 Javascript
-
 PHP
PHP
-
 Economics & Finance
How to change the Y-axis title in base R plot?
The easiest way to change the Y-axis title in base R plot is by using the ylab argument where we can simply type in the title. But the use of ylab does not help us to make changes in the axis title hence it is better to use mtext function, using which we can change the font size, position etc. of the title.
Check out the below example to understand how it can be done.
Example
Use the code given below to change the Y-axis title in base R plot −
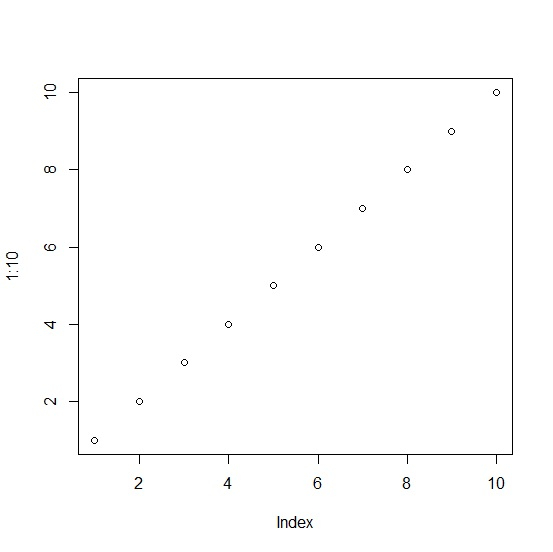
plot(1:10)
Output
If you execute the above given code, it generates the following Output −
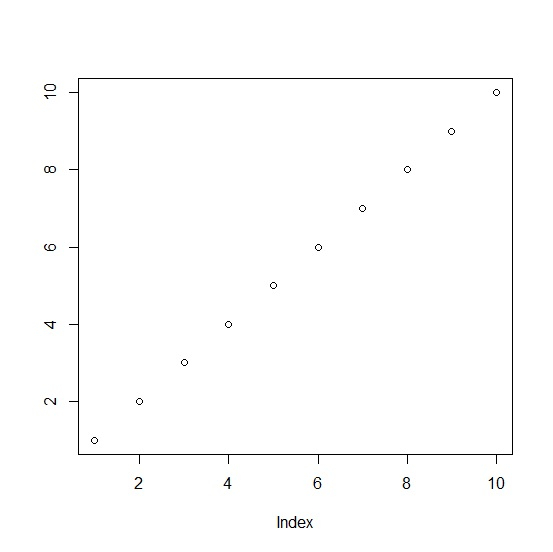
Add the following code to the above snippet −
plot(1:10,ylab="")
Output
If you execute the above given code, it generates the following Output −
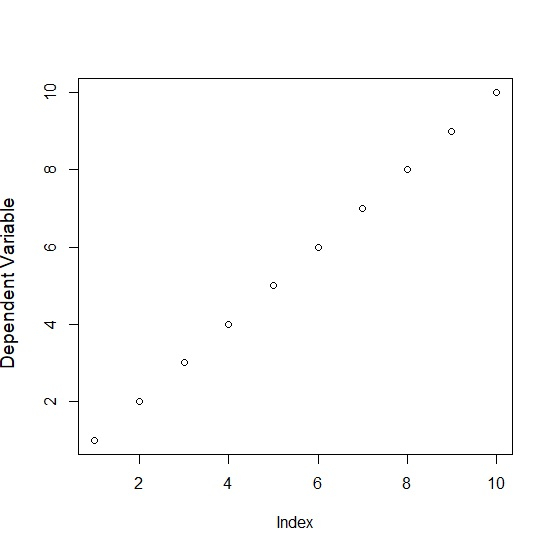
Add the following code to the above snippet −
plot(1:10,ylab="")
mtext(expression(paste( plain("Dependent Variable"))),side=2,line=4,padj=1,at=5,cex=1.2)
Output
If you execute the above given code, it generates the following Output −

10K+ Views
