
Article Categories
- All Categories
-
 Data Structure
-
 Networking
-
 RDBMS
RDBMS
-
 Operating System
-
 Java
Java
-
 MS Excel
-
 iOS
iOS
-
 HTML
HTML
-
 CSS
CSS
-
 Android
-
 Python
-
 C Programming
-
 C++
C++
-
 C#
C#
-
 MongoDB
-
 MySQL
MySQL
-
 Javascript
-
 PHP
PHP
-
 Economics & Finance
Selected Reading
How to display legend in base R with different colors?
To display legend in base R with different colors, we can follow the below steps −
First of all, create a plot using plot function.
Then, use legend function legend argument and col argument to display legend with different colors.
Example
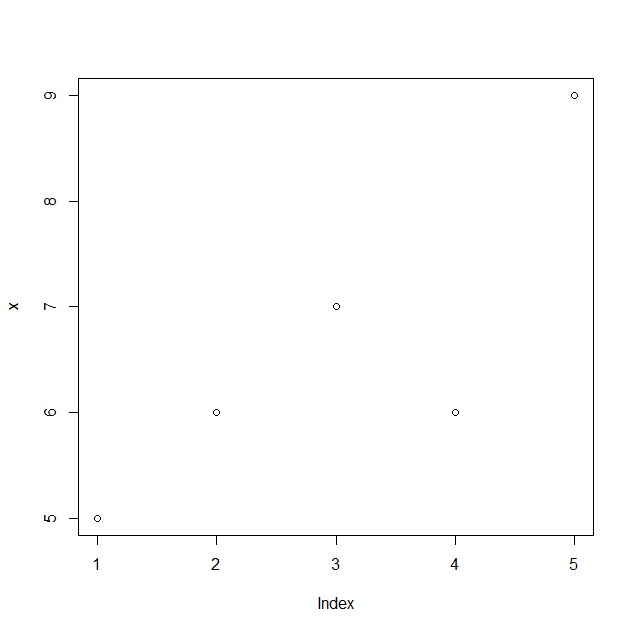
Create the plot
Let’s create a plot of a vector x using plot function −
x<-rpois(5,5)
plot(x)
Output
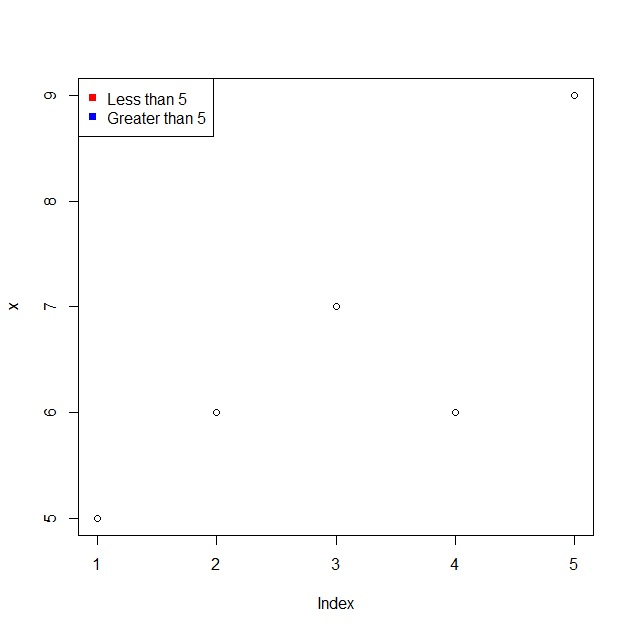
Display legend with different colors
Using legend function legend argument and col argument to display legend with red and blue colors −
x<-rpois(5,5)
legend("topleft",legend=c("Less than 5","Greater than 5"),pch=15,col=c("red","blue"))
Output

Updated on: 2021-11-11T07:01:24+05:30
2K+ Views

Advertisements