
Article Categories
- All Categories
-
 Data Structure
-
 Networking
-
 RDBMS
RDBMS
-
 Operating System
-
 Java
Java
-
 MS Excel
-
 iOS
iOS
-
 HTML
HTML
-
 CSS
CSS
-
 Android
-
 Python
-
 C Programming
-
 C++
C++
-
 C#
C#
-
 MongoDB
-
 MySQL
MySQL
-
 Javascript
-
 PHP
PHP
-
 Economics & Finance
Selected Reading
How to change the background color of base R plot region?
To change the background color of base R plot region, we can follow the below steps −
First of all, create a plot in base R to understand the difference.
Then, use par function with bg argument where you can put color name and then create the same plot.
Example
Create the plot
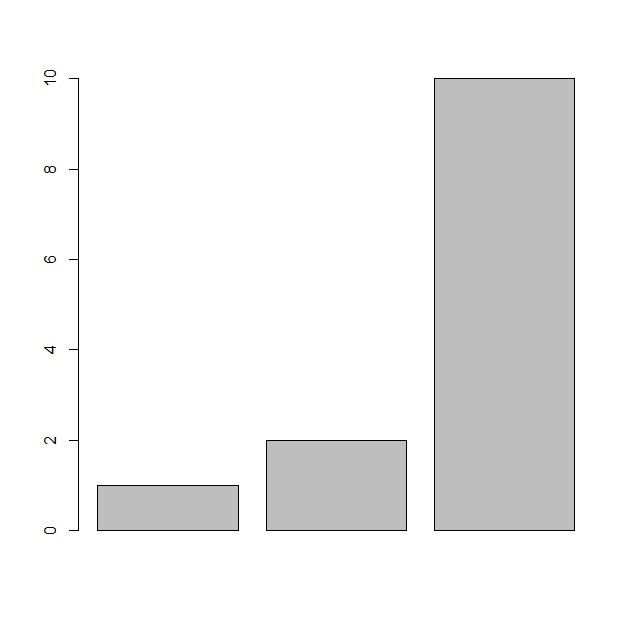
Let’s create a barplot in base R as shown below −
x<-sample(1:10,3)
barplot(x)
Output
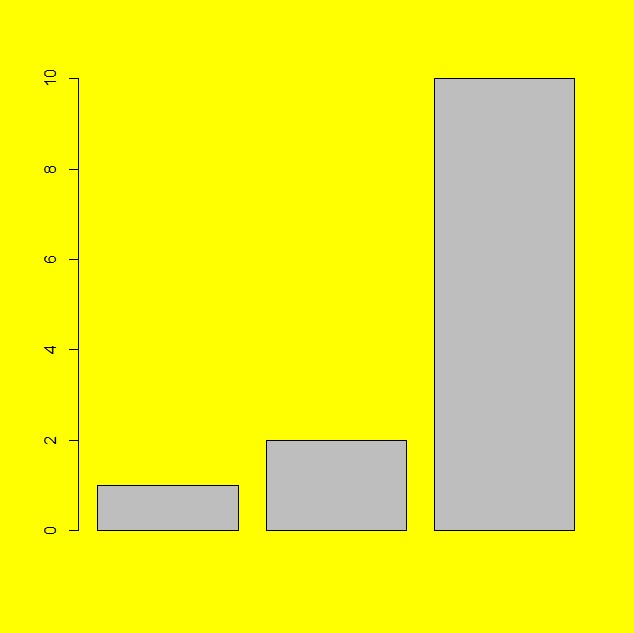
Create the plot with changed background color
Using par function with bg argument having yellow color and then creating the barplot −
x<-sample(1:10,3)
par(bg="yellow")
barplot(x)
Output

Updated on: 2021-11-11T07:12:26+05:30
1K+ Views

Advertisements