- ggplot2 - Home
- ggplot2 - Introduction
- ggplot2 - Installation of R
- ggplot2 - Default Plot in R
- ggplot2 - Working with Axes
- ggplot2 - Working with Legends
- ggplot2 - Scatter Plots & Jitter Plots
- ggplot2 - Bar Plots & Histograms
- ggplot2 - Pie Charts
- ggplot2 - Marginal Plots
- ggplot2 - Bubble Plots & Count Charts
- ggplot2 - Diverging Charts
- ggplot2 - Themes
- ggplot2 - Multi Panel Plots
- ggplot2 - Multiple Plots
- ggplot2 - Background Colors
- ggplot2 - Time Series
- ggplot2 Useful Resources
- ggplot2 - Quick Guide
- ggplot2 - Useful Resources
- ggplot2 - Discussion
Selected Reading
ggplot2 - Background Colors
There are ways to change the entire look of your plot with one function as mentioned below. But if you want to simply change the background color of the panel you can, use the following −
Implementing Panel background
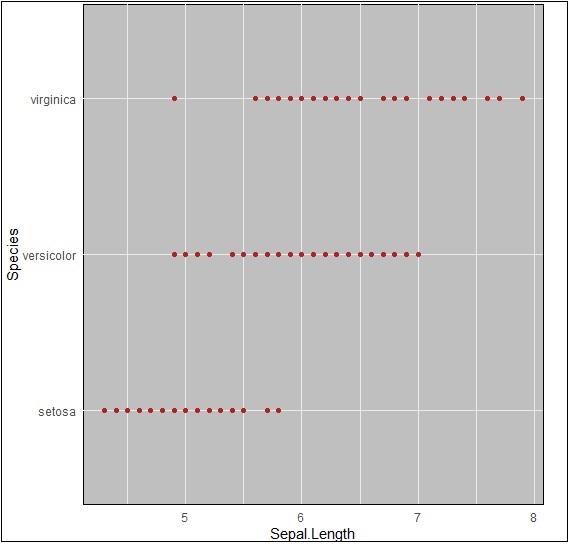
We can change the background color using following command which helps in changing the panel (panel.background) −
> ggplot(iris, aes(Sepal.Length, Species))+geom_point(color="firebrick")+
+ theme(panel.background = element_rect(fill = 'grey75'))
The change in color is clearly depicted in picture below −
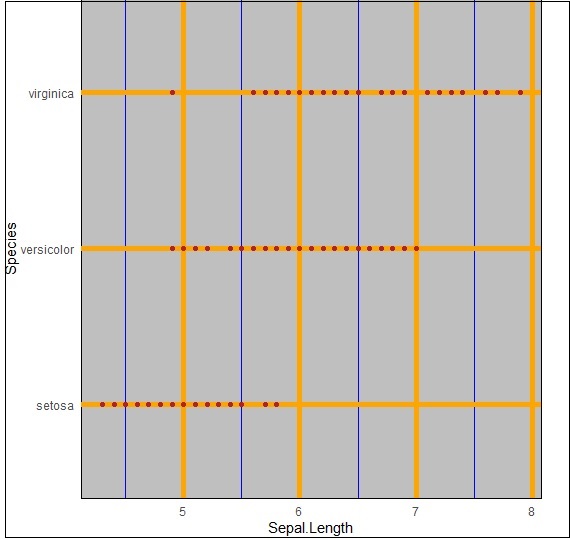
Implementing Panel.grid.major
We can change the grid lines using property panel.grid.major as mentioned in command below −
> ggplot(iris, aes(Sepal.Length, Species))+geom_point(color="firebrick")+
+    theme(panel.background = element_rect(fill = 'grey75'),
+    panel.grid.major = element_line(colour = "orange", size=2),
+    panel.grid.minor = element_line(colour = "blue"))
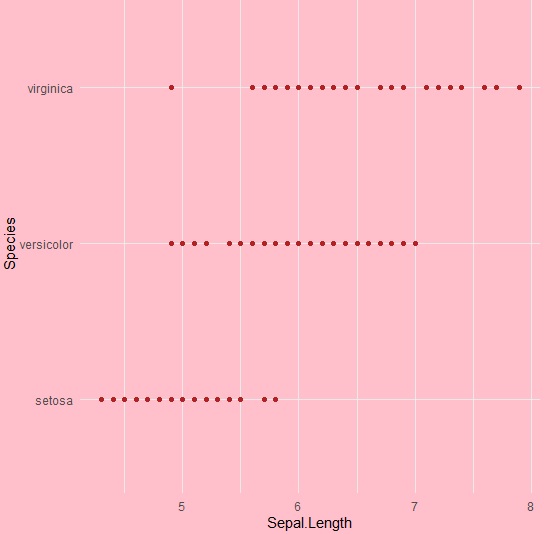
We can even change the plot background especially excluding the panel using plot.background property as mentioned below −
ggplot(iris, aes(Sepal.Length, Species))+geom_point(color="firebrick")+
+   theme(plot.background = element_rect(fill = 'pink'))
Advertisements