
Article Categories
- All Categories
-
 Data Structure
-
 Networking
-
 RDBMS
RDBMS
-
 Operating System
-
 Java
Java
-
 MS Excel
-
 iOS
iOS
-
 HTML
HTML
-
 CSS
CSS
-
 Android
-
 Python
-
 C Programming
-
 C++
C++
-
 C#
C#
-
 MongoDB
-
 MySQL
MySQL
-
 Javascript
-
 PHP
PHP
-
 Economics & Finance
How to Add Vertical/Average Line to Bar Chart in Excel?
We can add a vertical/average line to a bar chart in Excel by using the horizontal bar graph. The average line is used to analyse the data value in the graph but checking whether we have reached the average or not in the particular interval. Adding vertical average line to a bar chart in Excel is a simple but lengthy process.
In this tutorial, we will show you the step-by-step process to add a vertical/average line to bar chart in Excel.
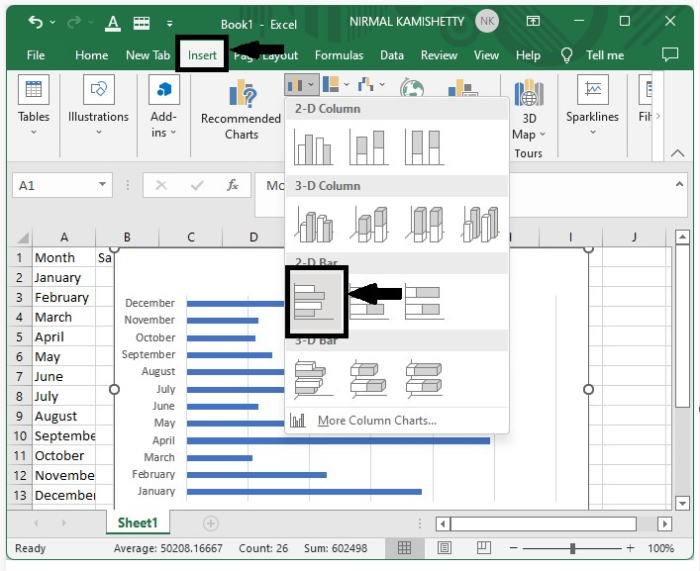
Step 1
First, we need to create a horizontal bar chart. Select the data and then click "Insert". Then select "clustered bar" under "bar graph", as shown in the image below ?
Our bar graph will be crated successfully.
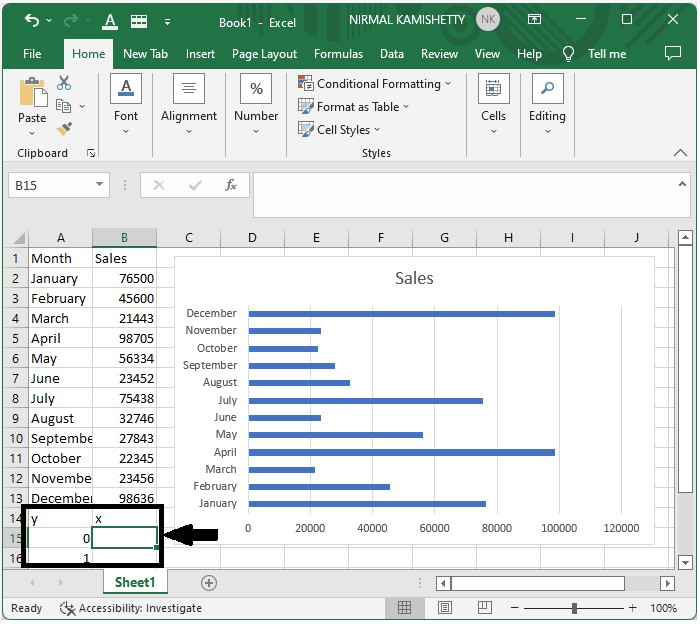
Step 2
Now add extra "x" in the new row under "Month" and "y" in new row under "Sales" and enter two new values "0" and "1" under "x", as shown in the following screenshot ?
Step 3
Click the cell under "x" and enter the formula.
"=AVERAGE($B$2:$B$13)"
And press the "Enter" button to get the average.
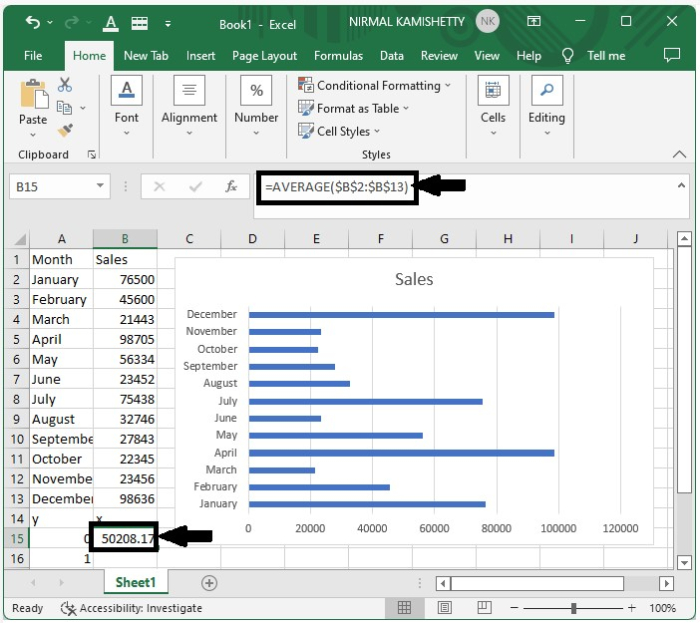
Drag down from the average value of zero to get the average value of "y=1" and it will be same as average for "y=0"
Step 4
Right-click on the graph and click "select data". A pop-up will open and then click "Add" under the legend entries and then enter the series name as average and value as the average value we got in the above step.
Step 5
Right-click on the new series created in the graph. Select "change chart type" and then select scatter with line under "x? y graph" menu and finally click the "OK" button.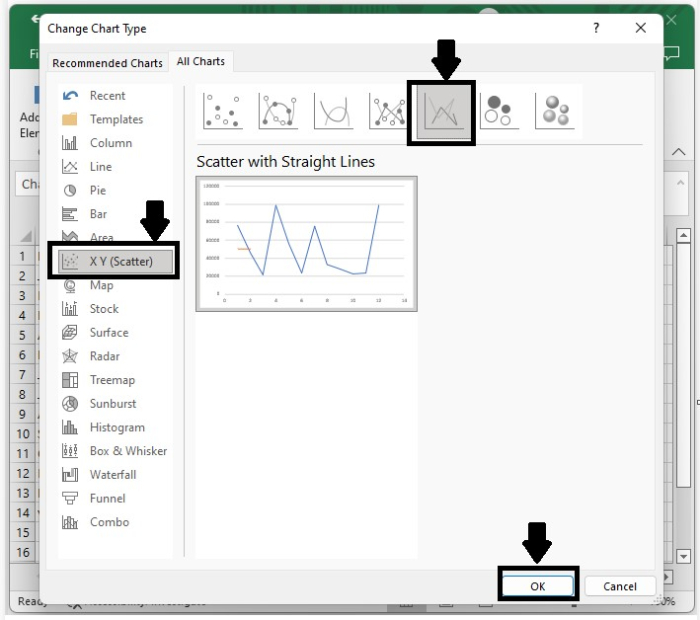
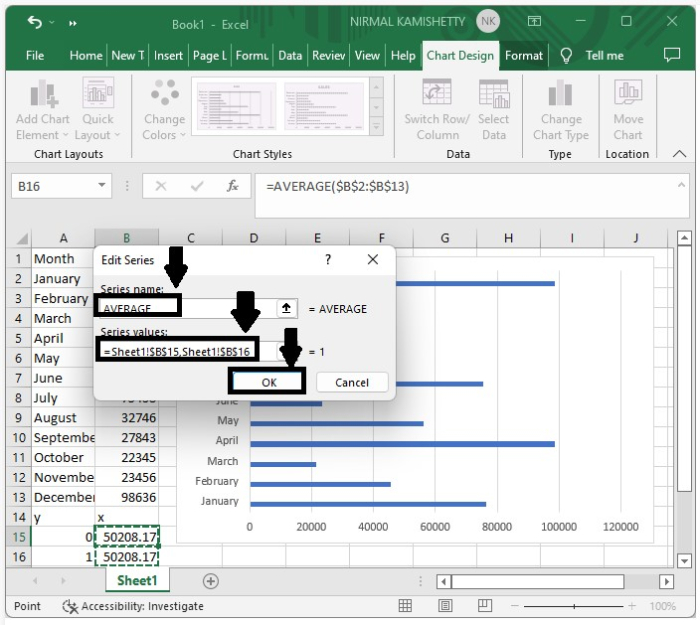
Step 6
Again right-click on the graph, and click "select data". A pop-up will open, click "average" and select "edit".
Then enter "x" value as average value. In our case, it will be 50208.1667 and enter the value as 0 and 1 and keep the name as "average".
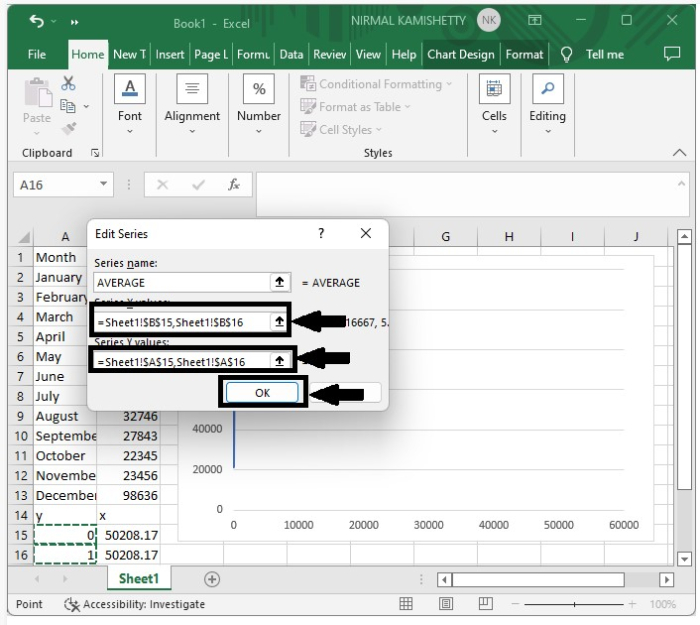
Click "ok" and close the dialog box, then adjust the scale to complete the graph successfully.
Step 7
The straight line will be created across the bar graph successfully, as shown in screenshot below.
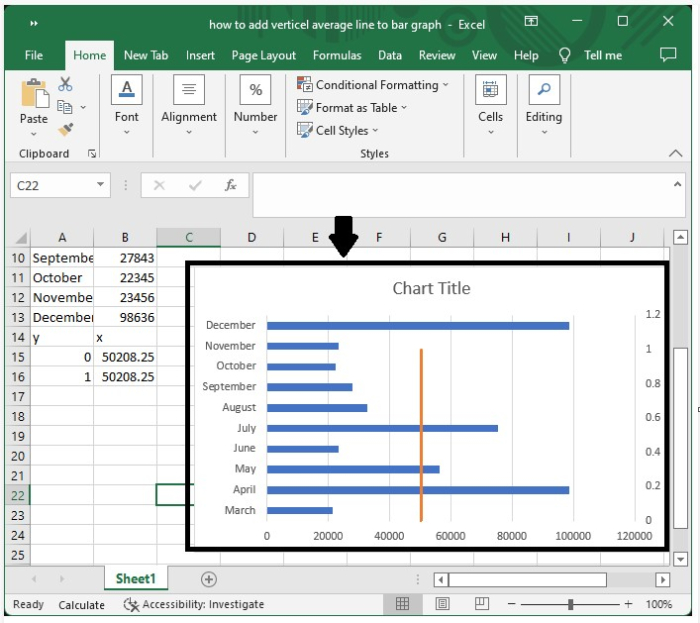
In this tutorial, we explained in a step-by-step manner how you can add a vertical line to a bar graph in Excel.

1K+ Views
